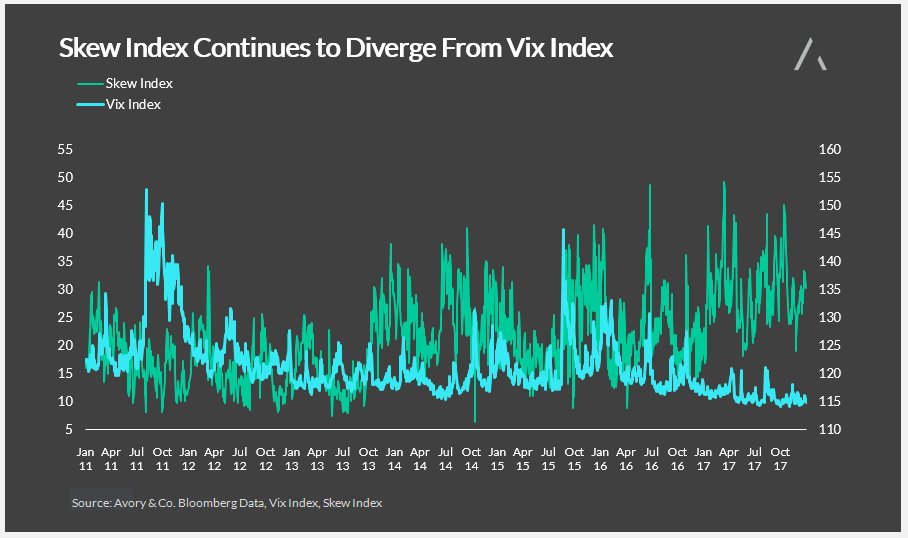
SKEW Index Continues To Diverge From VIX Index
The story of volatility has been very one-sided of late. There’s been low volatility despite various geopolitical headlines which in the past would have...
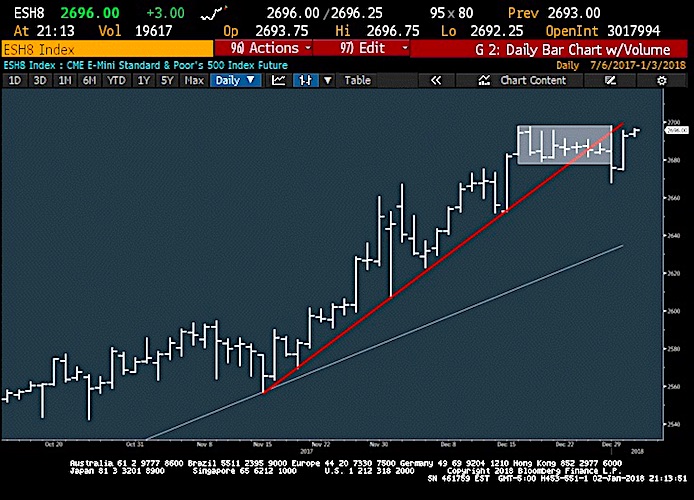
S&P 500 Trading Outlook: Equities Rally Extended
S&P 500 Trading Outlook (2-3 Days): BULLISH
Yesterday's recovery of last week's decline suggests an upcoming push back to new highs is likely for equities. This...
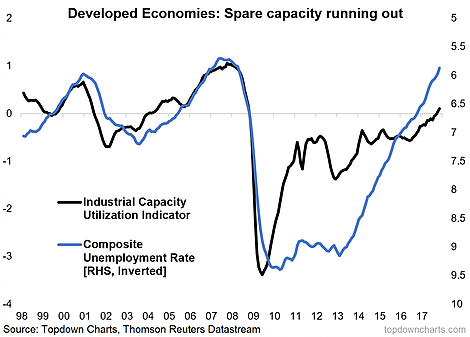
Top 10 Charts For Investors To Watch In 2018
I spent a lot of time this past week looking back across 2017. I reviewed some of my best charts and market/macro calls of...
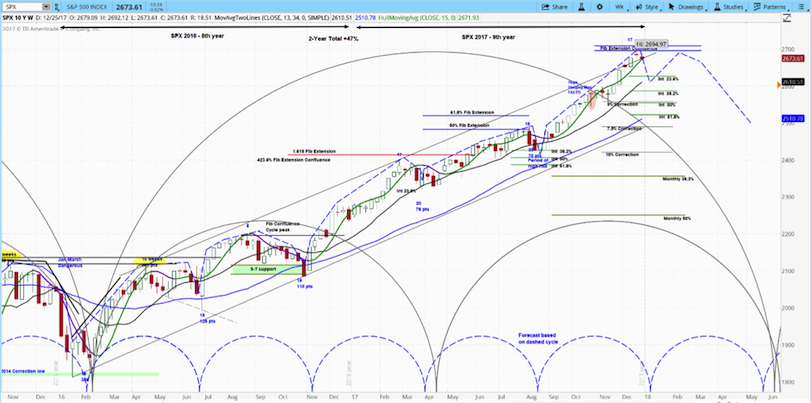
2018 Stock Market Cycles Outlook: New Highs… After A Dip
The stock market closed a positive chapter last week as 2017 saw the S&P 500 return 20 percent.
What will 2018 bring? Let's discuss what's...
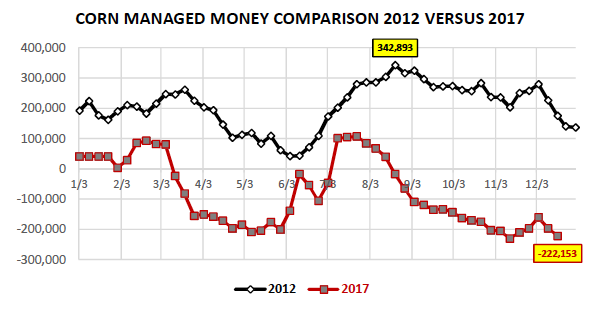
2018 U.S. Corn Market Outlook: The Bulls Wish List
With March corn futures continuing to languish well below $4.00 per bushel heading into 2018 and memories of $6.00, $7.00, and even $8.00 per...
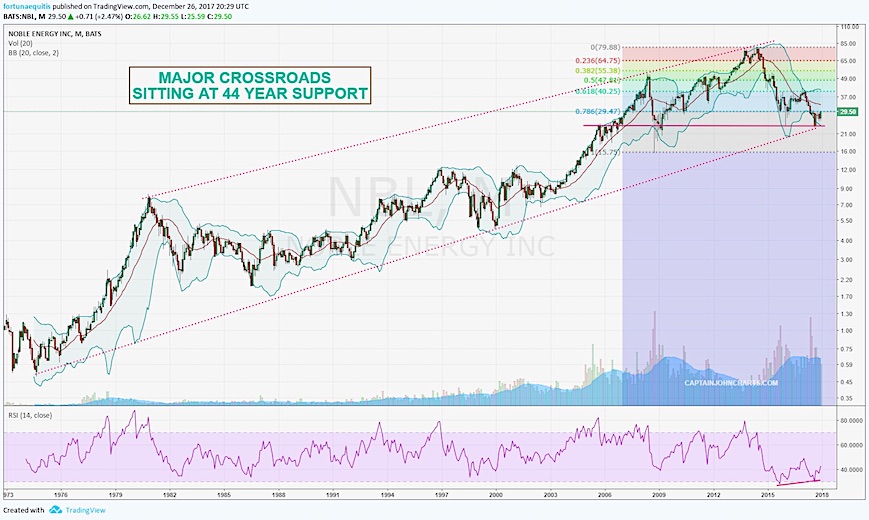
Noble Energy Stock Bouncing Off 44 Year Price Support
In October, I explored the technical analysis of Noble Energy's monthly stock chart (NBL) and the important technical signals it was sending to investors....
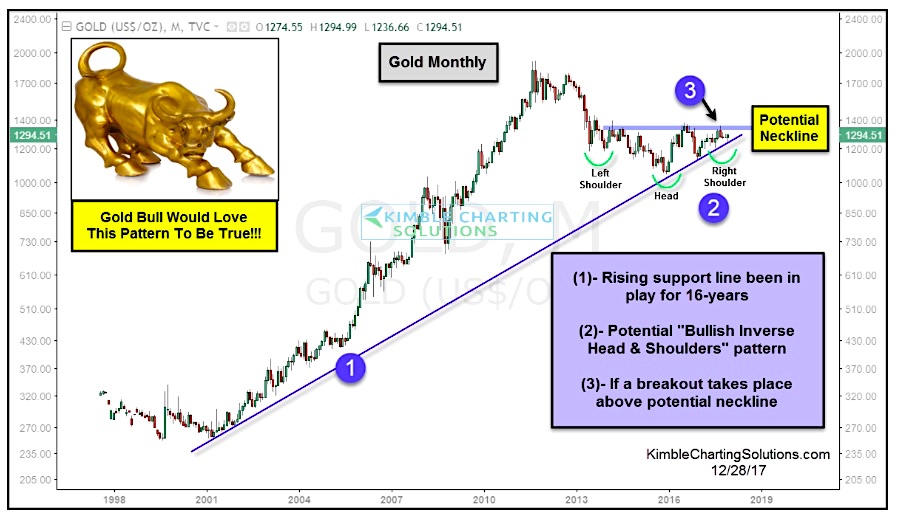
Gold Bulls Hope This Chart Pattern Leads To Big Rally
The past 6 years have been difficult for gold bulls. After the 2011 market top for precious metals, gold experienced a waterfall decline followed...
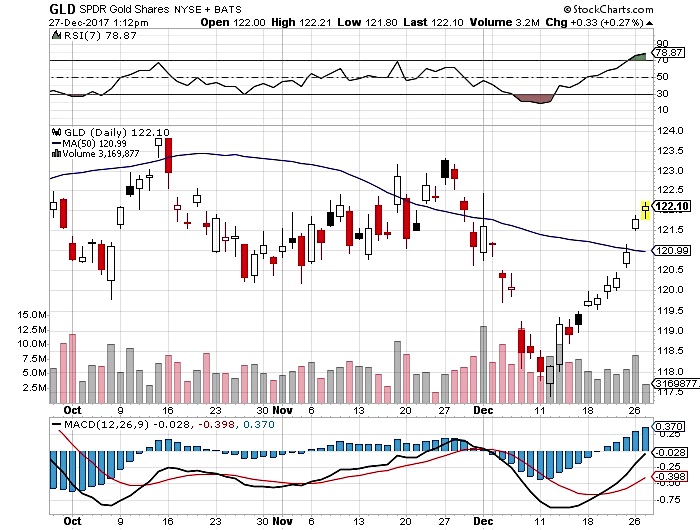
Gold Prices Pivot Higher As Strong Seasonal Period Approaches
Earlier this month, as Bitcoin mania was in full swing, we checked in on the other pure store of value: GOLD.
We discussed seasonal tendencies...
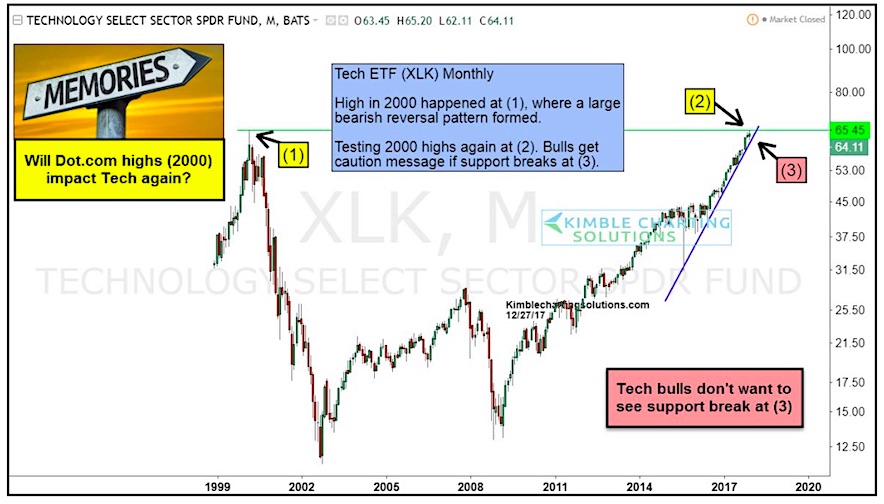
Will 2000 Tech Bubble Highs Slow This Popular ETF (XLK)?
Nearly 20 years ago, the Nasdaq tech fervor was sowing the seeds of the "tech bubble" as tech stocks rocketed higher to crazy valuations.
This...
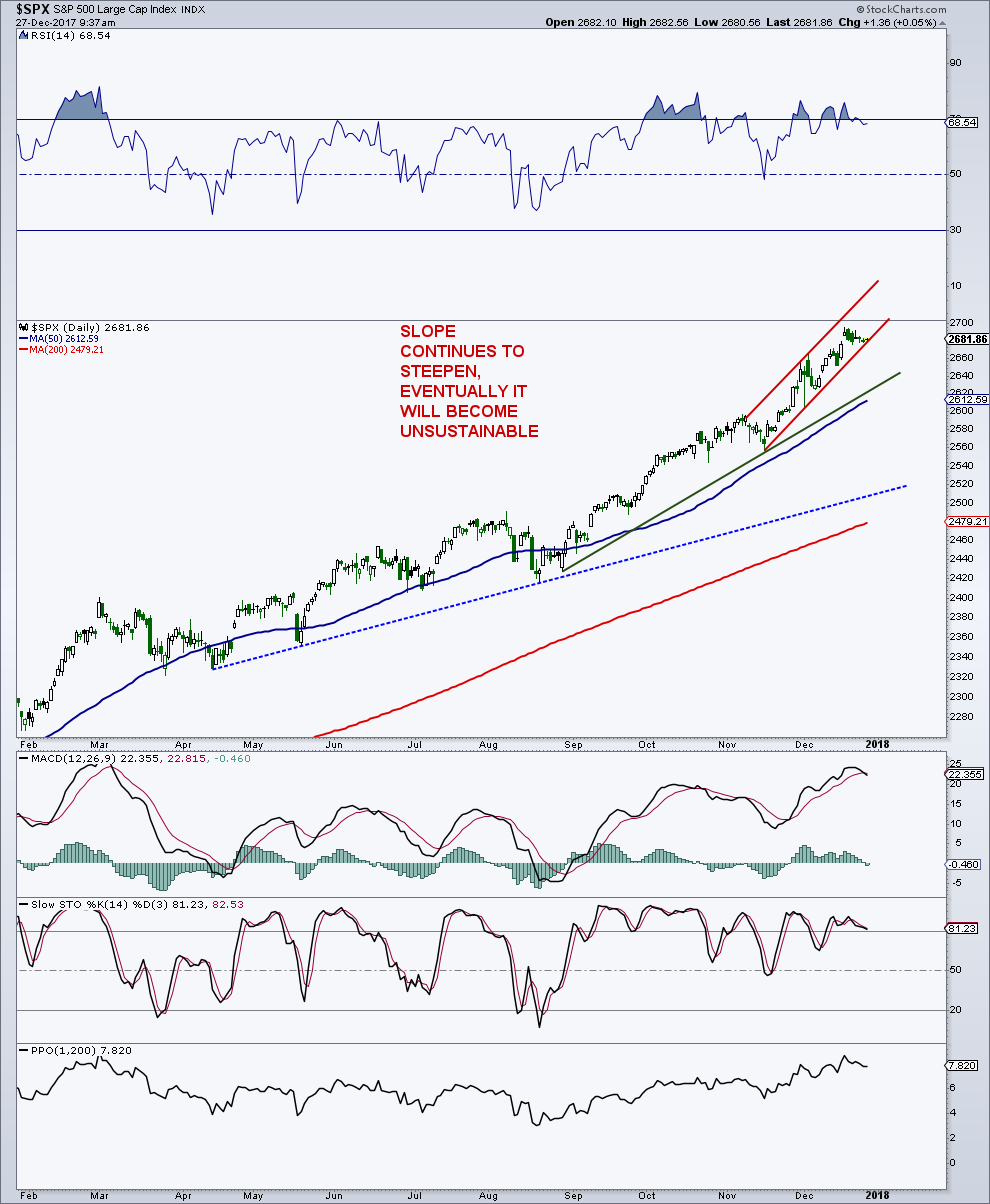
U.S. Equities Technical Outlook: Big Round Numbers
The S&P 500 is once again bumping its head against another round number, as 2,700 has come into focus.
Interestingly, a couple of other stock...

