In October, I explored the technical analysis of Noble Energy’s monthly stock chart (NBL) and the important technical signals it was sending to investors. You can read that post here.
Our introductory analysis proposed the following question: “Is there an end to this road or a major reversal to the upside in this crossroads moment?”
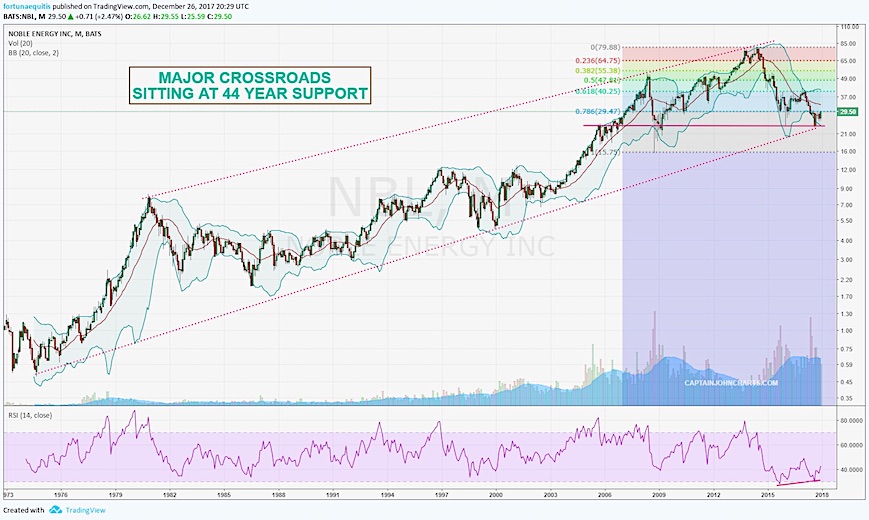
If you have been following the stock chart action you have seen the bounce and what looks like a major reversal now in action. There are bullish divergences in price and in the momentum (RSI) right where we would expect such action with a 44-year support line in play. See chart above.
So what does Noble Energy’s stock (NBL) look like on a zoomed in chart? Bullish
NBL’s stock price took time to develop a bottom. Like a diamond, these things take time to form before they reveal whether they are top quality or failures at support. According to John Butcofski, the Daily stock chart also appears bullish with a breakout of an Ascending Triangle Pattern and an Inverted Head and Shoulders pattern.
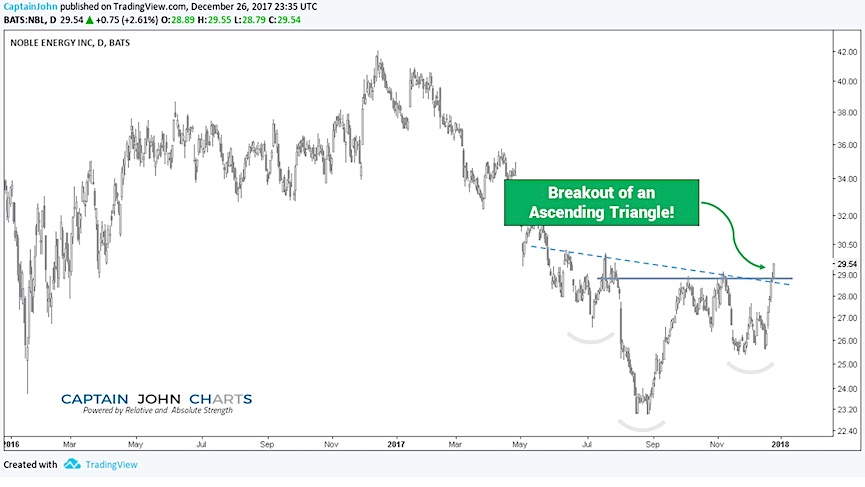
If the Head and Shoulders pattern plays out, we are looking at a possible target of 6+ points added onto $29.54 which takes price to the $35 range. Bearish price resistance resides at $34.
NBL was up in trading post-Christmas Day over 2% and since our first article here with price at $28.31 it has moved up 3.64% (intraday price as of 12-28-2017). Had advisors/investors allocated a million dollars, following our adaptability rules they would be staring at a $36,400 gain, and it’s just beginning.
I would re-iterate what I said in my October article that “this is a buying gift from the angels” if it can bounce at the bottom band and long-term support channel and continue with positive upside follow through, this dusty gem could shine bright like a diamond.
If you are interested in learning more about our investing approach and financial services, visit us at CaptainJohnCharts.
Twitter: @CptJohnCharts & @FortunaEquitis
The author has a position in the mentioned securities. Any opinions expressed herein are solely those of the author, and do not in any way represent the views or opinions of any other person or entity.


