10-Year US Treasury Bond Yield Trading At Important Resistance
All the talk is about interest rates.
Political pressure on the Fed to lower interest rates is nearing a crescendo. It's annoying. But in every...
Lower Interest Rates: A Big Piece of the Inflation Puzzle
With FOMC minutes published today, most Fed members eye rate cuts this year, but are split on what are the next steps.
One must cynically...
Are Long-Dated Treasury Bonds A Place For Safety?
A war in the Middle East can have significant and multifaceted impacts on the United States.
Typically, oil and gas would have the biggest impact...
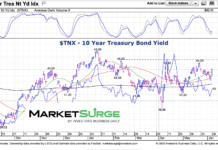
10-Year Treasury Bond Yield in Sideways Pattern
There has been a lot of chatter about interest rates. And investors would love to have clarity on this issue.
But, it's almost better as...
Long-Dated Treasury Bonds Nearing A Rally?
Among the throngs of headlines on X, this one came out today
PRESIDENT DONALD TRUMP JUST SAID: - ANNOUNCED THE TARIFF PAUSE BECAUSE PEOPLE GETTING...
Treasury Bonds Aren’t Feeling The ‘Flight To Safety’ Love
It's been a volatile end of the month, to say the least.
Stocks are on the ropes and investors are getting sweaty.
So bonds must be...
Is It Time to Look at Fixed Income and Inflation Protection?
Recently, I was asked on CNBC Asia what I thought about fixed income at the present time.
My answer was that I thought having cash...
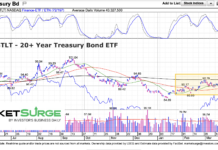
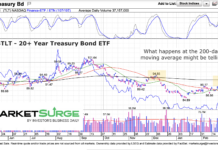
Treasury Bonds (TLT) Rally Nears Important Resistance
Treasury bond yields have turned lower over the past 6 weeks. And that means treasury bonds and the popular treasury bonds etf (TLT) have...
Long Treasury Bonds Indicator Says Risk OFF, But With a Twist
Turnaround Tuesday brought some interesting charts. What bulls do not want to see, is when long-dated treasury bonds (which have turned around) outperform both...
Post Federal Reserve: Treasury Bonds (TLT) Outlook and The Year of the Snake
First, I would like to express to my colleagues, friends and followers:
May the Year of the Snake guide your endeavors to great heights. Gong...


