August Stock Market Trading Not For The Faint Of Heart
August is a tough month to trade in the stock market.
There has been seasonal weakness over the past 35 years.
Liquidity is diminished and the...
US Dollar Breaks Down; New Lows Forecast
The US Dollar currency has come under pressure lately and it isn't showing any signs of abating.
The dollar broke its uptrend line this week...
U.S. Dollar Selloff Testing Important Support… For The 3rd Time!
The U.S. Dollar has been pretty darn weak for the past several weeks.
Since December, it's fallen from around 109 to 100.
Is this short-term freefall...
3 Important Inflation Indicators to Watch Right Now
Today, I want to leave you with some thoughts with charts on inflation and, more specifically, 3 key inflation indicators to watch in 2025.
I...
Is U.S. Dollar Topping Pattern Pointing To Broader Concerns?
The U.S. Dollar Index rallied sharply into inauguration day. Since then, it's been very weak.
Could things get worse for King Dollar?
Today, we share a...
Bullish Bitcoin Headlines Swirl, But Price Rules the Narrative
The most recent bitcoin rumor hot off the press is that the US Securities and Exchange Commission (SEC) may create a national $BTC reserve.
This has...
US Dollar Index Attempting Bullish Reversal Higher
The US Dollar Index (DXY) is turning up from its rising 50-day moving average.
The reversal also comes from a confluence of technical support.
Our trading...
US Dollar Rally Near Critical Inflection Point!
In a world where the US Dollar still makes the world go round, it's vitally important that investors pay attention to potential pivot points...
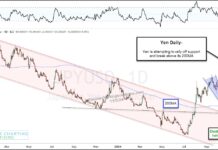
Is the Japanese Yen Oversold and Ready To Rally?
The Japanese YEN has been weak versus the US Dollar over much of the past 2 years.
However, that trend could coming to an end...
US Dollar Set For Further Weakness Post-Election?
The US Dollar is the world's reserve currency and, as such, it garners a lot of attention from traders, investors, and media.
Out-sized moves in...


