August is a tough month to trade in the stock market.
There has been seasonal weakness over the past 35 years.
Liquidity is diminished and the volume is thin.
Stock Market volatility can rise.
Tax loss selling and rebalancing often occurs among institutions ahead of the end of the 3rdquarter.
Earnings momentum and fading optimism can taper off in August.
I ended my day with Maggie Lake.
Plus, this will be my last daily market update until I return from a vacation on August 25th.
Maggie and I covered a lot as always, and the link is available here.
Here are some of the notes I sent her ahead of time.
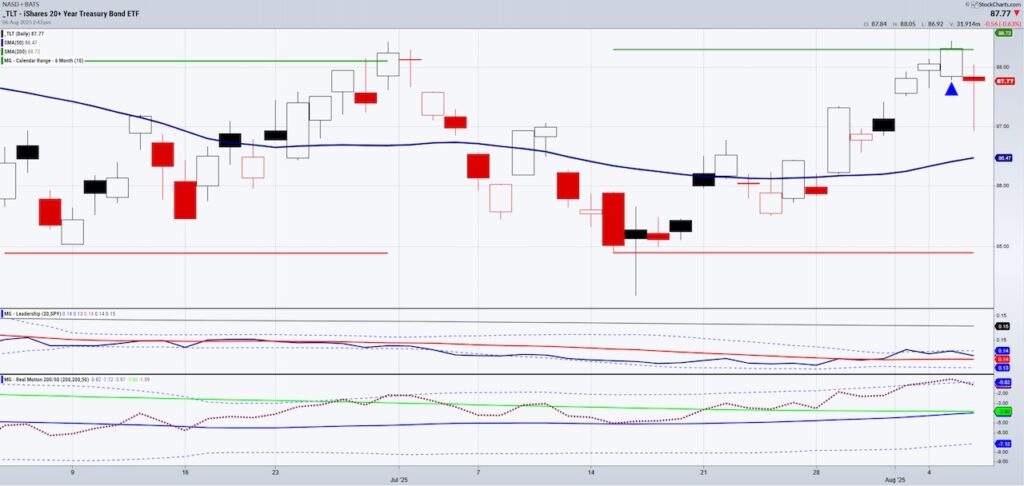
- Yields topped as predicted and now, we could see further drop-looking at TLT basing but fun starts over 90. The dollar failed 100 if breaks 98 new leg down over 100 could see 103
Above is a chart of 20 Year US Treasury ETF (TLT). It represents everything I covered with Maggie and in other Dailys.
TLT, after an auction today, sold off. However, the chart is clear. The rally Tuesday was to the July 6-month calendar range high (I talk a lot about that).
The S&P 500 (SPY) continues to outperform for now which shows risk on.
The Real Motion Indicator had a mean reversion sell signal right at the calendar range high.
HOWEVER, the dots are above the moving averages while the price is above the 50-DMA and below the 200-DMA. A bullish divergence.
What I discussed with Maggie is the possibility that yields drop further, TLT clears the resistance and SPY, can continue to run as well, but watch for the performance to shift.
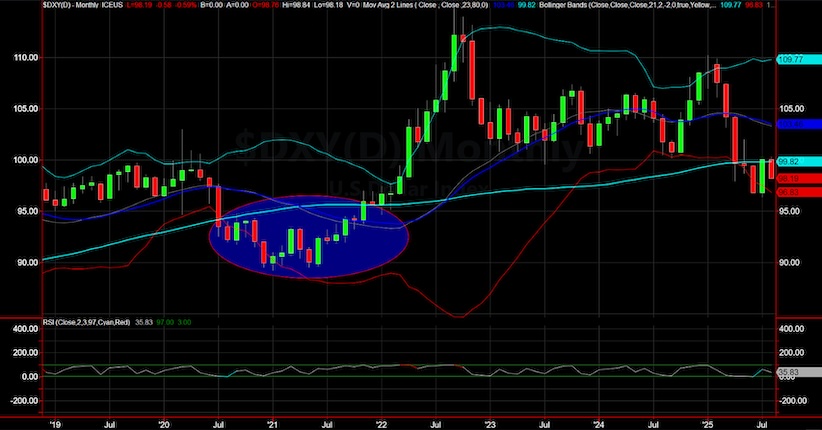
This is the monthly chart of the dollar.
The rally back up to the 80-month moving average (100) was a perfect technical bounce into longer term resistance.
The dollar under 98 will look more like a failure and reason to believe it will head even lower.
This is bullish for commodities and Maggie and I cover a lot about energy and the various raw materials related to energy.
Has Natural Gas bottomed?
Very possibly.
Maggie and I also discussed gold and how it looks great over 3350 and over 3450 we could see new all-time highs.
Silver, 38.50 is the point to clear and then 40 is the breakout.
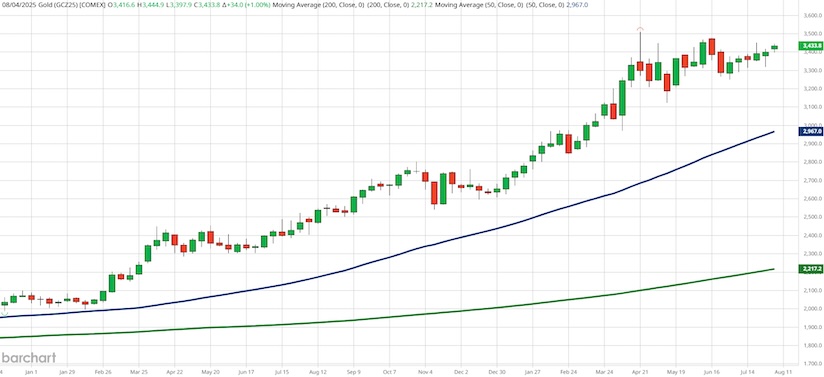
This is the October contract of gold.
I have heard a lot of bears out there.
I do not see any bearish case in this chart.
The 3 charts I include in the Daily should help you determine risk and the next direction of the market.
A weakening dollar, lower yields and rising gold prices are generally risk off.
Should gold sell off, yields remain flat, and the dollar runs up, the market may hold, so that is when you refer to the July 6-month calendar ranges.
What is breaking out, down or stuck in a range.
I will return August 25th.
Thank you for your support and readership!
Twitter: @marketminute
The author may have a position in mentioned securities at the time of publication. Any opinions expressed herein are solely those of the author and do not represent the views or opinions of any other person or entity.


