Will Investors See More Stock IPOs In 2nd Half of Year?
The following research was contributed to by Christine Short, VP of Research at Wall Street Horizon.
The global IPO count nearly doubled this past quarter...
Is the Japanese Yen Currency Nearing an Historic Bottom?
The Japanese Yen currency has been in a strong selloff for the past 12+ years.
Today we ask: Could the Yen finally be bottoming?
As you...
Symbotic Stock (SYM) Showing Bullish Buy Potential
Symbotic Inc. (SYM) is an automation technology company that focuses on improving operating efficiencies in modern warehouses.
Here are some key points about Symbotic:
Business Focus:...
Can Treasury Bonds Remain Bullish Despite Monday’s Setback?
Over the weekend we covered the weekly charts of our favorite stock market ETFs, which we call the “Economic Modern Family”. You can read...
The Stock Market Requires 7 Pairs of Eyes!
These are the weekly charts of the Economic Modern Family.
We begin by featuring the original six.
We will then look at our 7th member, and end...
Russell 2000 Rally Pushes It Over July Calendar Range
Very Simply, small caps are on fire!
Note the small green horizontal line.
That is the new July 6-month calendar range high.
IWM handled it like a...
Silver Breaks Out; Short-Term Price Target $34
Precious metals continue to show strength with both gold and silver at or near multi-year highs.
And the sector may get another bullish boost from...
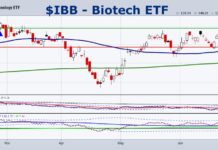
The Biotechnology Sector ETF (IBB) Clears Price Resistance
On June 24, 2024 I wrote a daily called, Biotechnology Sector IBB Breakout Comes To Life:
“IBB sits just below the 200-WMA. Plus, he is in the...
Can Momentum Build In Small Cap Stocks?
We have heard many discussions on whether small cap stocks and the Russell 2000 ETF (IWM) really matter for the broader stock market.
Here are...
Sugar Is An Important Inflation Barometer… And It May Be Heading Higher
Mother Nature can be such a B@*^H!
On March 6, 2024 I wrote a market update on sugar and inflation.
The biggest takeaway is:
We will know...


