The past 6 years have been difficult for gold bulls. After the 2011 market top for precious metals, gold experienced a waterfall decline followed by a “lower low” and more sideways price action.
Every rally seemed to stall out. Every hope was met with “not this time”.
That type of price action is grueling and tends to grind out weak hands. To put it mildly, it’s very difficult to hold an asset that goes nowhere while the stock market zooms higher.
Gold Bulls Last Stand?
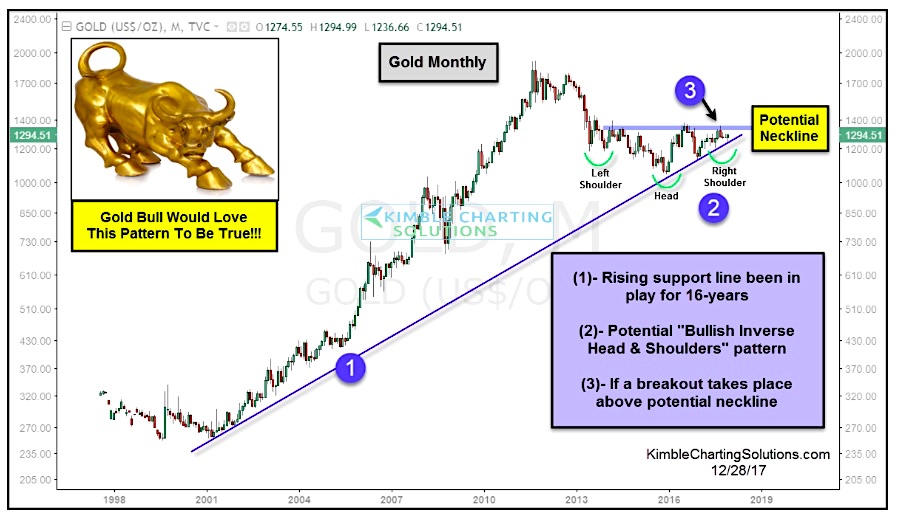
So, is there any hope for gold now? Looking at the chart below, it appears so. We may be looking at a very bullish chart pattern in action: an “inverse head & shoulders”. Heres a breakdown of the chart setup below:
- Point (1) represents the uptrend line dating back to 2001.
- Point (2) highlights a bullish “head and shoulders” price pattern.
- Point (3) highlights the “neck line” of that pattern.
If the neck line is broken to the upside, gold bulls will be able to have some fun again. Traders and portfolio managers should watch this neck line closely – a strong move through this price area would signal higher prices ahead.
Gold Prices 20-Year Chart
Twitter: @KimbleCharting
Any opinions expressed herein are solely those of the author, and do not in any way represent the views or opinions of any other person or entity.


