The S&P 500 is once again bumping its head against another round number, as 2,700 has come into focus.
Interestingly, a couple of other stock market major indices are close to dealing with bigger round numbers too, with the Dow Jones Industrial Average nearing the 25,000 level and the NASDAQ Composite flirting with 7,000.
While not a reason to sell, with the increasingly heated sentiment and low price stock speculation, maybe that long overdue pullback is just around the corner.
Outside of stocks, treasuries got whacked, gold bounced, while crude oil continues to percolate under $60/barrel.
General Observations:
Traders in the Rydex mutual fund family are leveraged to the long side to a record degree. There is nearly $17 invested in leveraged long funds for every $1 in leveraged short funds. The other 2 times we saw spikes like this, the “500” dropped by more than 5%, although the declines were temporary. Source: Jason Goepfert @ www.sentimentrader.com
Twitter Joke of the Week:
Maybe investors should buy a basket of sub $5 stocks in hopes of a company name change with blockchain in it. Rumors flying that many company boards are meeting as we speak. My twitter: @MarkArbeter
Seasonality:
December remains positive, especially for the small cap Russell 2000. Interestingly, January, which used to be a very positive month, has not been great to investors recently. Over the past 5 years, the S&P 500 only rose 40% of the time in January and had an average loss of 1%. Going out 20 years, it was 50/50 for the “500” with an average loss of 0.7%.
Over the past 5 years, the NASDAQ rose 40% of the time and saw an average loss of 0.7%. For the past 20 years, it was 50/50 with an average gain of 0.7%. The Russell 2000 rose only 40% of the time over the past 5 years and saw an average loss of 1.7%. For 20 years, the RUT rose 40% of the time and saw an average loss of 0.7%.
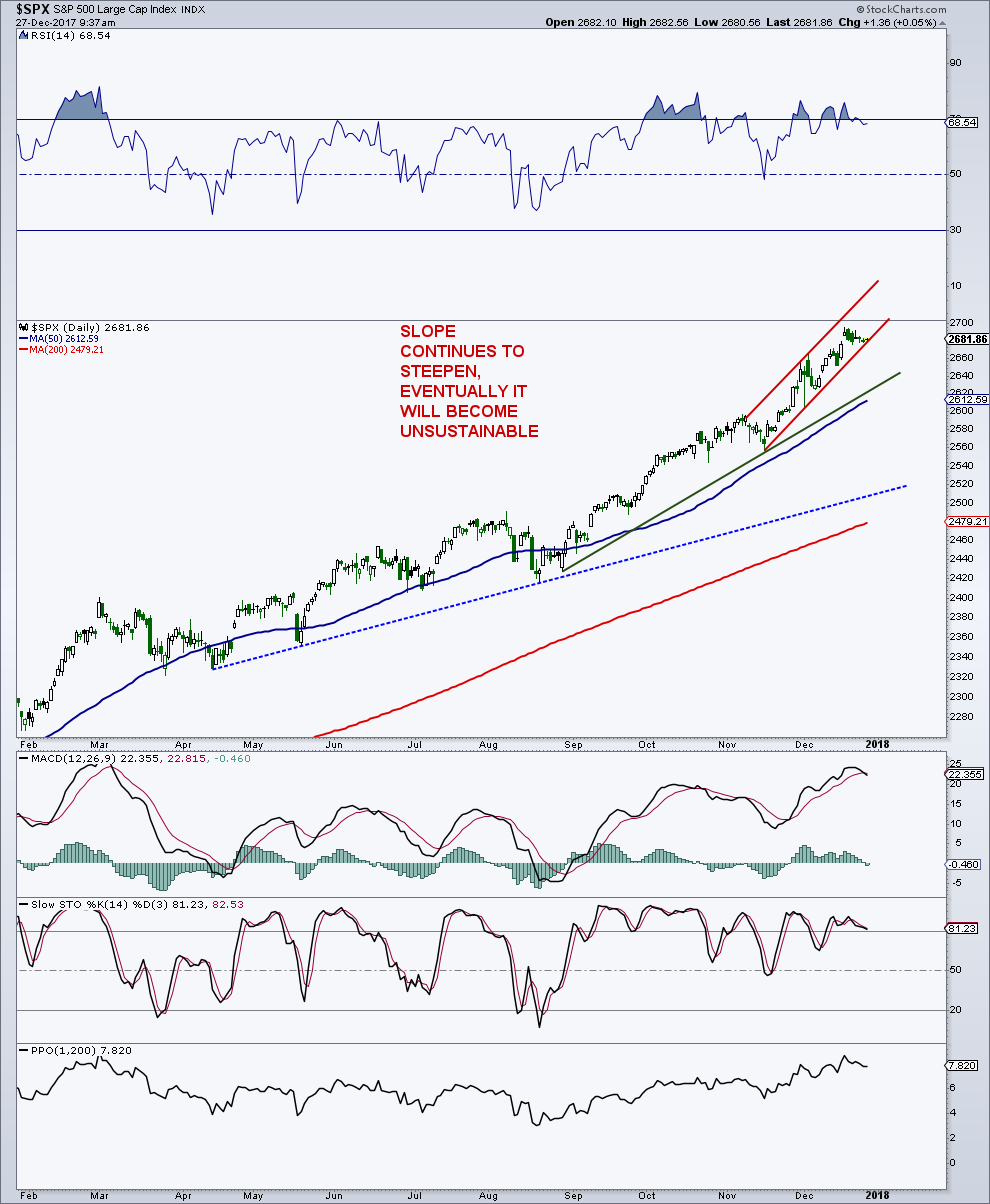
S&P 500 INTERMEDIATE TERM:
On the daily chart, the “500” continues its ever increasing slope, which potentially could lead to a blowoff top. Other than the slope and the fact that we have not witnessed a pullback in a long time, there is nothing from a price perspective that is bearish here. The ability to stay overbought, whether it’s the 14-day RSI or daily MACD, is quite impressive. In addition, the continued narrow ranges and absence of any real price volatility is about as good as it gets technically. Yet, as we will see, sentiment is in the scary zone so a good old fashioned shakeout would be a wonderful prescription to cool the masses.
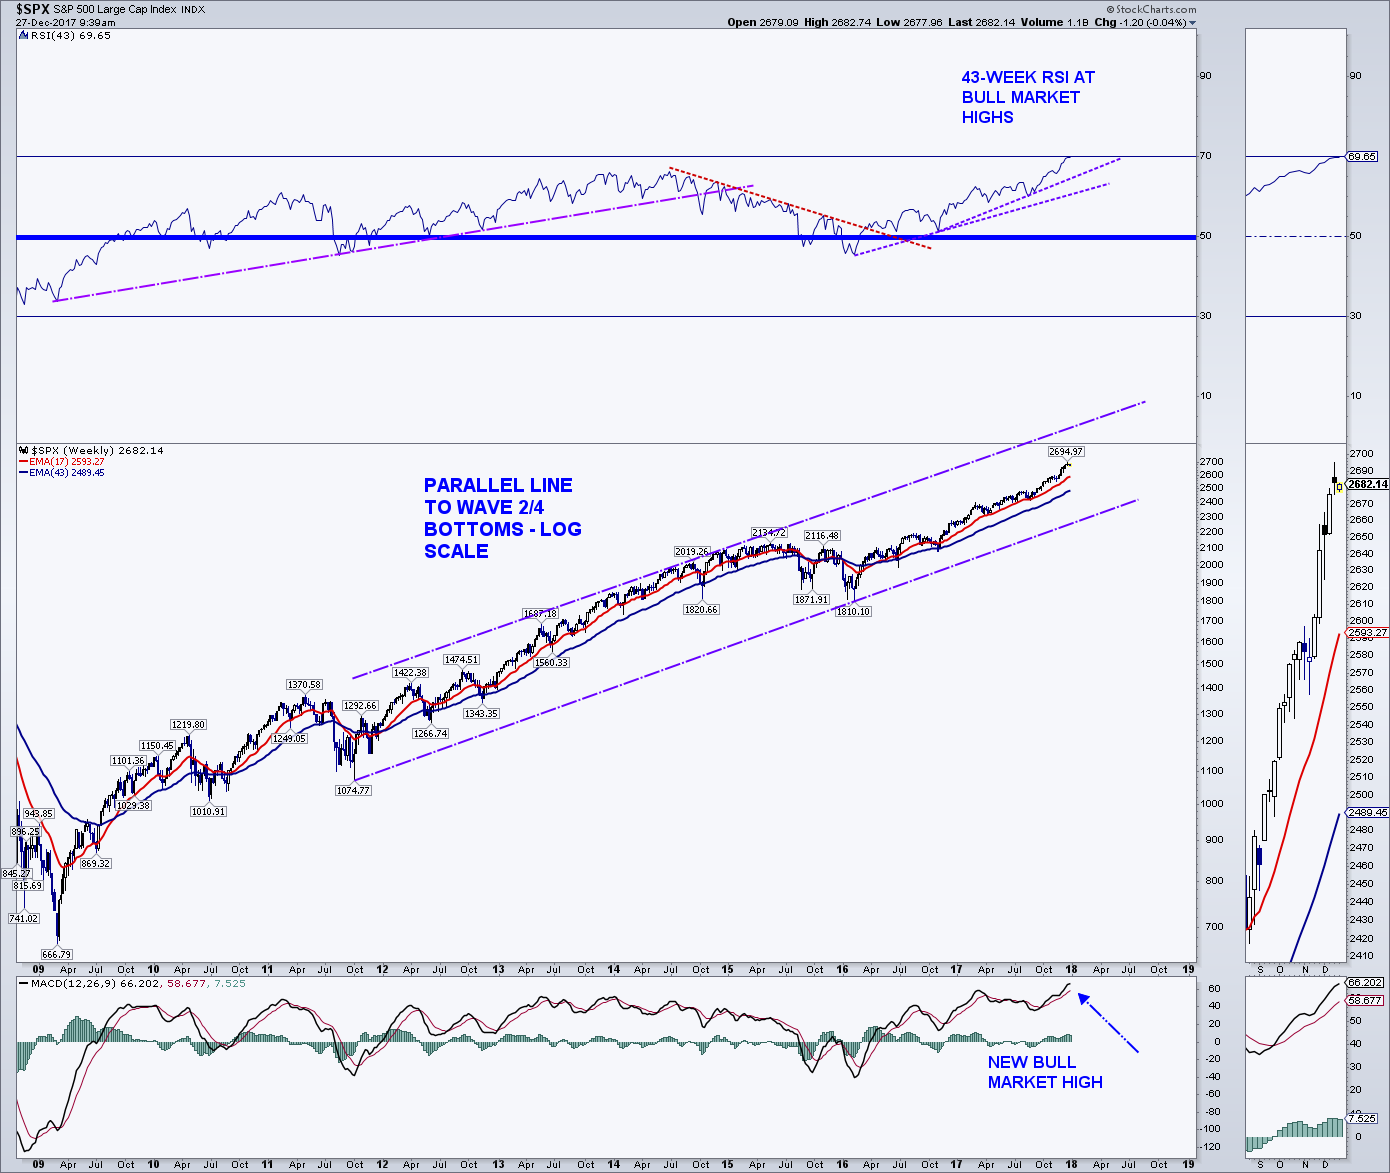
S&P 500 LONGER TERM:
The weekly chart is still bullish, with both price and momentum (14W RSI) making new bull market highs. Generally, momentum on a longer-term chart (weekly, monthly) peaks well before price so the new high in the RSI suggests a major top is not in the cards in the months ahead. In other words, we usually see bearish divergences from the weekly momentum indicators before/concurrent with a major market top.
My price targets between 2,650 and 2,700 have been met, and while I’m still bullish, I am holding off on new targets for now.
Quite frankly, there really are not any more readable targets from the chart that can be given. Certainly a trip up to the upper channel is a possibility, but I do not want to get into that yet.
Thanks for reading.
Feel free to reach out to me at arbetermark@gmail.com for inquiries about my newsletter “On The Mark”. Thanks for reading.
Twitter: @MarkArbeter
The author does not have a position in mentioned securities at the time of publication. Any opinions expressed herein are solely those of the author, and do not in any way represent the views or opinions of any other person or entity.
: Creating Bullish Divergence?")


 and Semiconductors (SMH): Concerning Price Pattern?")


