The stock market closed a positive chapter last week as 2017 saw the S&P 500 return 20 percent.
What will 2018 bring? Let’s discuss what’s happening now and what our 2018 stock market cycle looks like…
S&P 500 Summary & Cycle Outlook:
- The S&P 500 closed higher in four out of its last four market cycles, and is set to do the same for the current cycle.
- However, we believe that stocks will have a significant correction as their intermediate cycle ends and the market bottoms around mid-year.
- Once that cycle is complete, we project the S&P 500 will turn around and move to a new all-time high by the end of 2018.
Wow. Wasn’t last year crazy? Scratch that – how about the last two years? From it’s low of 1810 in February 2016, the S&P 500 (SPX) added 885 points at its high of 2695.
That’s an impressive gain of 33% – most of which occurred in 2017. This may have been due to strong growth in corporate earnings, as well as anticipation of the Republican plan to cut corporate taxes.
But after this run, it may feel to some like this move will continue. That’s because if you’ve been even the slightest bit skeptical, you’ve been proven wrong at every turn, or rather during every cycle.
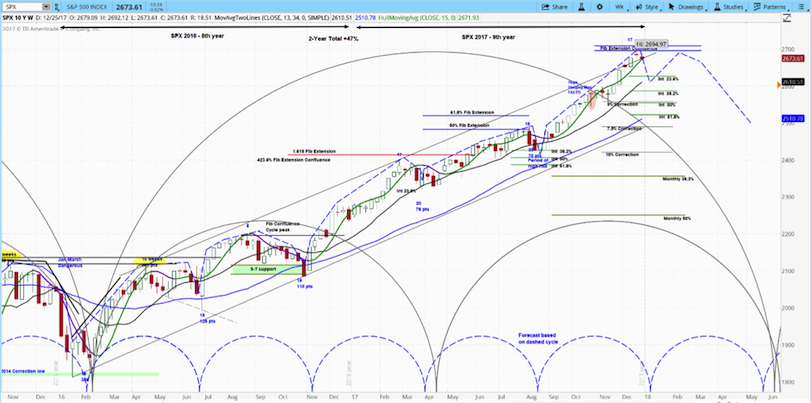
In case you’re unfamiliar with our analytical style, it’s called cycle analysis. The semicircles that you see on the chart above represent ideal market cycles that measure the distance from low to the next.
The smaller blue semicircles drove SPX price action over the last two years. These cycles last about 20 weeks. Sometimes it’s more, sometimes less – this is not an exact science.
When the cycles ended, they brought corrections of between 70 and 129 points. However, the cycle that ends in June 2018 will coincide with the completion of the larger market cycles, which are represented by the black semicircles.
This means the SPX will have three market cycles pushing price action lower during this period. As such, we expect to see a correction of 10% or more from the high of 2695.
You may dismiss our analysis as another negative call amongst the chorus of bears that we heard in 2017. But there’s a kicker.
Once those cycles end, we expect the SPX to turn around and move to all-time highs towards the end of the year. While that period is not included in the chart above, we will cover this topic –and beyond– in a future “big picture analysis” video.
We normally conclude with our short-term view for the SPX. So let’s return to the current cycle that will end in the first few weeks of January. We expect this to produce a move lower, but frankly there’s not much time left in this cycle for anything more than a modest dip.
For a more detailed look at cycle analysis for a broader selection of futures, watch the askSlim Market Week every Friday afternoon.
The latest askSlim Market Week tackles our stock, commodities (and bitcoin) predictions for 2018:
Twitter: @askslim
Any opinions expressed herein are solely those of the author, and do not in any way represent the views or opinions of any other person or entity.


: Showing Some Signs of Emerging Strength")
