S&P 500 Trading Outlook (2-3 Days): BULLISH
Yesterday’s recovery of last week’s decline suggests an upcoming push back to new highs is likely for equities. This in turn would make the first five days of January positive for the stock market.
Market breadth was meager, at less than 2/1 positive overall. However, Tech, Energy, Materials, Healthcare and Consumer Discretionary all finished at over 1% positive, with a meaningful breakout in the Oil Services Sector and strength in gold and silver stocks.
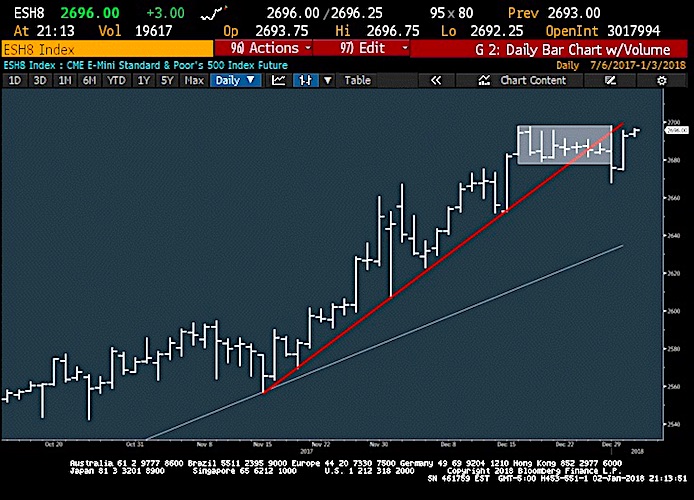
A move over 2698 for the S&P 500 will provide another quick pop and full backtest of trend line (see chart below). Movement to new highs seem likely, even if short-lived. 2670 is key support on the downside for equities.
S&P 500 Futures Chart
TECHNICAL THOUGHTS
Action Plan
Staying long most Metals stocks remains my preferred play. Steel (SLX) has just broken out above 2017 highs to the highest levels since 2014. Gold stocks and Silver continue to make progress.
Within ENERGY, the Oil Services ETF OIH has just broken out which should let this ETF play catchup to XLE and XOP. Staying long most Oil Service names looks right for the next 3-5 days.
Commodity ETFs like DBC or XLB offers exposure to the entire commodity space, with Agriculture starting to turn higher and Chemicals still acting well.
US over Europe remains preferred with SPY favored over VGK, EZU, or IEV.
General Thoughts
Overall, Tuesday’s ability to regain last week’s losses keeps the S&P 500 pointed higher, for a likely push back to new highs.
Bullish sentiment, overbought conditions, cyclical concerns and monthly Demark counter-trend exhaustion on indices remain concerns, while Europe has turned down sharply to the lowest levels since September which should be watched carefully. Yet, stock index prices have not turned lower in the US and there continue to be quite a few attractive charts which are showing multi-year base breakouts. Most of Asia remains quite bullish, with China having shown recent breakouts which lines up with some of the recent Emerging markets strength.
The metals space continues to be a preferred area for longs in the short run, with gold and silver demonstrating good strength following much of the bullish action in the Base metals in recent weeks. The materials complex in general and most stocks coinciding with commodities are showing very good strength and should be favored. Stocks like IP, AA have recently broken out from multi-year bases, and given the ongoing decline in the US Dollar, bode well for further strength in commodities and stocks that correlate well with the Commodities space.
If you are an institutional investor and have an interest in seeing timely intra-day market updates on my private twitter feed, please follow @NewtonAdvisors. Also, feel free to send me an email at info@newtonadvisor.com regarding how my Technical work can add alpha to your portfolio management process.
Twitter: @MarkNewtonCMT
Author has positions in mentioned securities at the time of publication. Any opinions expressed herein are solely those of the author, and do not in any way represent the views or opinions of any other person or entity.


