Bonds issued by companies with a credit rating of BB or lower by S&P or Fitch, or Ba or lower by Moody’s, are considered junk bonds.
Junk bonds, or high-yield bonds because the interest payments are higher than for the average corporate bond, pay high interest rates to entice investors to take on the greater risk of lending them money.
Doesn’t that sound like an excellent reason why we use junk bonds as a reliable way to assess risk on or off?
Now let’s analyze today’s chart.
5 Key Takeaways from this chart:
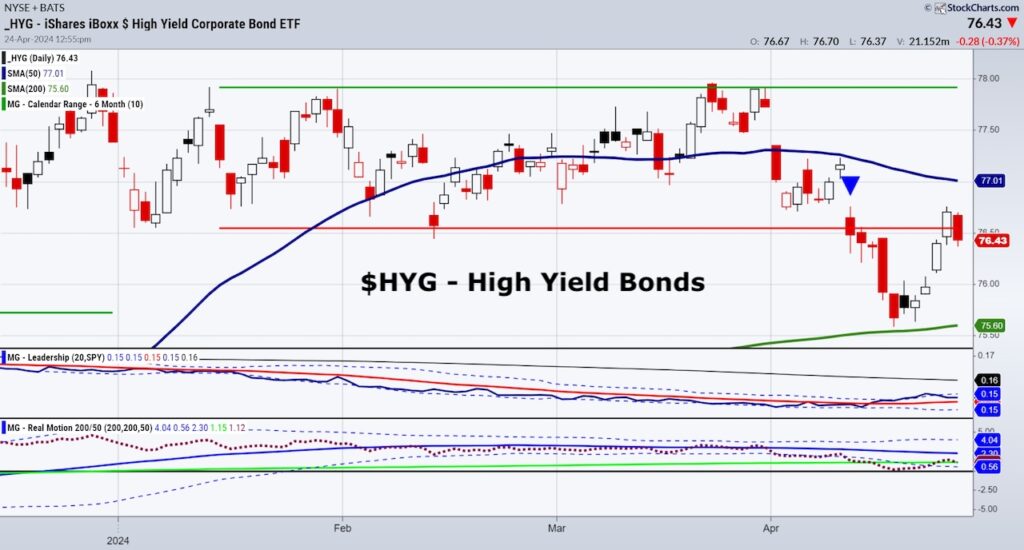
- While HYG has yet to clear the January 6-month calendar range, it sits (for the 2nd time) just under the 6-month calendar range low.
- HYG held the 200-DMA and 75.50 which is now major support.
- HYG had a mean reversion in momentum and currently sits in alignment with price (above the 200-DMA)
- The July 6 month calendar range you see if you look to the left, is acting, along with the current 200-DMA, as support.
- Under 75.50 risk will turn to off. Currently risk is more neutral. And a move over 77.00 or the 50-DMA will change the scenario to risk on.
Twitter: @marketminute
The author may have a position in mentioned securities at the time of publication. Any opinions expressed herein are solely those of the author and do not represent the views or opinions of any other person or entity.
")


")
