With March corn futures continuing to languish well below $4.00 per bushel heading into 2018 and memories of $6.00, $7.00, and even $8.00 per bushel corn from 2012 and 2013 growing more and more faded by the day, Corn Bulls have been left to consider whether or not corn futures will ever achieve such great heights again.
And if so, what fundamental changes are needed to reverse prices back upward following approximately 3 ½-years of low corn prices?
The following is my own personal assessment of what I believe is required to jump start a sustainable rally in corn futures early in 2018.
1. Significantly lower safrinha corn acreage in Brazil: Recent reports have suggested that corn prices in Mato Grosso, Brazil are currently trading well below the cost of production. Mato Grosso is the largest state corn producer of Brazil’s safrinha or second corn crop. Safrinha corn production now accounts for approximately 65% of Brazil’s total corn production (which is planted primarily in February and harvested in June/July/August). That said due to the continuation of low corn prices there are those speculating that Brazil’s safrinha planted corn acreage could decline 10 to 20% in 2018.
How could this impact U.S. corn futures prices? Considering Brazil is the world’s second largest corn exporter at 1.339 billion bushels (USDA’s current forecast for 2017/18), any significant production declines would likely translate into lower Brazilian corn exports. This in turn would be a major benefit to the U.S. (the world’s largest corn exporter) considering 2017/18 U.S. corn exports are still projected at just 1.925 billion bushels, down 368 million bushels from 2016/17. Ultimately any future increases in U.S. corn export demand would likely lower what continues to be a 30-year high in U.S. corn ending stocks of 2.437 billion bushels. For corn futures to move higher that carryout figure needs to start trending lower and a boost to exports would help.
2. 2018/19 U.S. corn planted acreage of 88 million acres: The annual average spot CME corn futures prices for years 2013-2017 have been as follows:
- 2013 = $5.781 per bushel, 2014 = $4.152 per bushel, 2015 = $3.767 per bushel, 2016 = $3.583 per bushel, and 2017 = $3.592 per bushel (as of 12/26).
Now consider that in 2013 the U.S. planted 95.4 million corn acres versus an average of 90.8 million corn acres for years 2014-2017. That equates to only a 4.8% planted acreage decline versus a 34.7% reduction in price (2013 average = $5.781 per bushel; 2014-2017 average = $3.774 per bushel). Add to this the influx of record to near record U.S. corn yields of 171 bpa in 2014, 168.4 bpa in 2015, 174.6 bpa in 2016, and 175.4 bpa in 2017, and what we’ve had is an unprecedented run of big acres / big yields outpacing nominal increases in total U.S. corn demand. This in turn has resulted in a prolonged cycle of depressed corn prices.
That said as it pertains specifically to the controllable supply-side variables, the quickest and most effective way to reduce the U.S. corn supply is to cut planted acreage. If 2018/19 U.S. corn planted acreage were reduced to 88 million acres, assuming 80.7 million harvested acres and a yield 171 bpa, total U.S. corn production would fall to 13.8 billion bushels, down 778 million bushels from 2017/18. The lower acreage figure would allow for a near record U.S. corn yield and yet still a tangible reduction in U.S. corn ending stocks (assuming U.S. corn demand remains relatively stable at approximately 14.5 billion bushels). For corn futures to move higher 2018 U.S. corn planted acreage needs to come down 1 to 2 million acres from 2017… Those 2 changes alone (lower safrinha corn planted acreage in Brazil and tangibly lower U.S. corn planted acreage in 2018) I believe would set the table for rallies back to $4.50 in December 2018 corn futures some time next Apr/May/Jun. However for rallies to materialize beyond that level some combination of the following also has to happen:
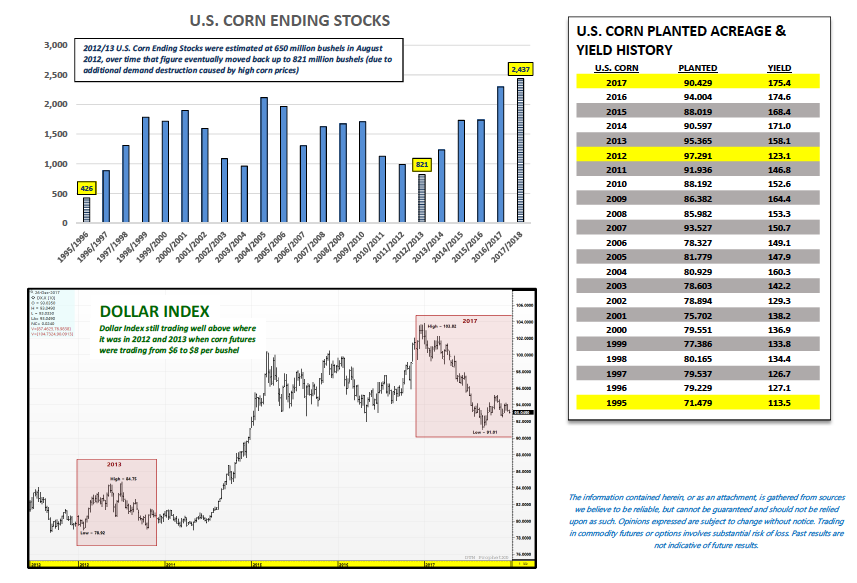
3. Deeper downward correction in the Dollar Index: The Dollar Index has drifted substantially lower for most of 2017; this after trading up to a day high of 103.82 on January 3rd, 2017 (highest level since December 2002). That said with the Dollar Index still hovering right around 93.0, it remains well above the levels associated with $6.00 to $8.00 per bushel corn futures from 2012 and 2013. By comparison in 2013 the Dollar Index traded in a low-to-high range of 78.92 to 84.75.
What’s the significance of a weaker Dollar? In theory a weaker Dollar makes U.S. exports more competitive (less expensive) and therefore the U.S. tends to see export demand increase. Additionally, from purely an investment point of view, money managers often shift a higher percentage of their investment dollars toward owning commodities during periods of Dollar weakness as a hedge against inflation. As a point of reference when corn was trading from $6.00 to $8.00 per bushel in 2012 and 2013, crude oil was trading from $90 to $110 per barrel (currently trading below $60 per barrel).
4. U.S. corn drought: It’s really no coincidence that the current record high in December corn futures of $8.49 occurred on August 10th, 2012. That same day the USDA released its August 2012 WASDE report, which offered a 2012/13 U.S. corn yield estimate of 123.4 bpa and a U.S. corn ending stocks projection of 650 million bushels (stocks-to-use ratio of 5.8%). The yield forecast represented the lowest U.S. corn yield since 1995/96 (113.5 bpa) and equated to a 19.6% yield decline versus the prior 5-year U.S. average (2007 – 2011 U.S. corn yield average = 153.6 bpa). Meanwhile the ending stocks forecast of 650 million bushels was also the lowest since 1995/96’s carryout of 426 million bushels.
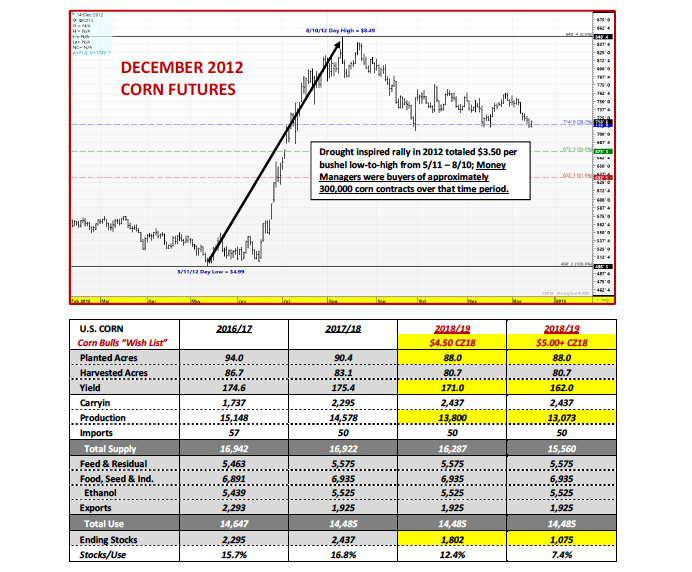
To put this in present terms with respect to what kind of yield that might liken to in 2018/19, the 5-year U.S. corn yield average from 2013 – 2017 is 169.5 bpa. Therefore a 19.6% yield decline would equate to a U.S. corn yield of 136.5 bpa in 2018/19. Now clearly that seems like a stretch “goal” for Corn Bulls with many traders now referencing the 2012/2013 U.S. corn drought as a “100-year drought.” However realistically…for December 2018 corn futures to trade back over $5.00 per bushel all I believe that’s required is the “fear” of a U.S. corn yield at or below 162 bpa. Assuming 2018/19 U.S. corn planted acreage falls to 88 million, that type of yield would imply total U.S. corn production of 13.07 billion bushels versus the 2017/18 figure of 14.58 billion bushels. That would obviously represent a massive swing in supply and would likely pressure U.S. corn ending stocks back under 1.3 to 1.4 billion bushels.
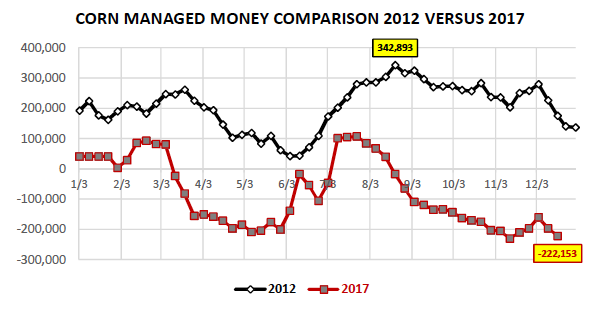
And where there’s a drought, even a perceived drought, the money will follow. On August 21st, 2012, the Commitment of Traders report showed Money Managers LONG +342,893 corn contracts. This was the high water mark for 2012, which overlapped exactly with the timing of December corn trading up over $8.30 per bushel on 8/10, 8/21, 8/22, and 8/23. At present Money Managers are carrying a net SHORT corn position of -222,153 as of December 19th, 2017, approximately 9,000 contracts shy of their current record corn short. That said Corn Bulls need the money shift back to the long side before any hopes of a sustainable rally can be solidified.
TO SUMMARIZE: In my opinion the U.S. corn balance sheet is never as comfortable nor as dire as it appears on paper. Therefore as it relates to the current U.S. corn ending stocks estimate of 2.437 billion bushels, although that feels somewhat insurmountable for Corn Bulls moving forward, the reality is just a few minor tweaks in 2018 to U.S. corn planted acreage and U.S. corn demand could create a much more price positive outlook.
Additionally should weather ever become a legitimate factor once again during the U.S. summer growing season (which we all know it will at some point), just a slightly below-trend yield figure now has the ability to tighten the U.S. corn stocks-to-use ratio up considerably with total U.S. corn demand running at 14.5 billion bushels.
“The darkest hour is just before dawn.” Let’s hope that holds true for 2018!
Twitter: @MarcusLudtke
Author hedges corn futures and may have a position at the time of publication. Any opinions expressed herein are solely those of the author, and do not in any way represent the views or opinions of any other person or entity.
Data References:
- USDA United States Department of Ag
- EIA Energy Information Association
- NASS National Agricultural Statistics Service

: Showing Some Signs of Emerging Strength")
