Nearly 20 years ago, the Nasdaq tech fervor was sowing the seeds of the “tech bubble” as tech stocks rocketed higher to crazy valuations.
This lead to the 2000 stock market top, one that will go down in stock market history (along with the Nasdaq’s prolific crash).
As many analysts and traders say, the market has a memory. Often times, key price levels and events serve as a psychological price barrier (i.e. resistance).
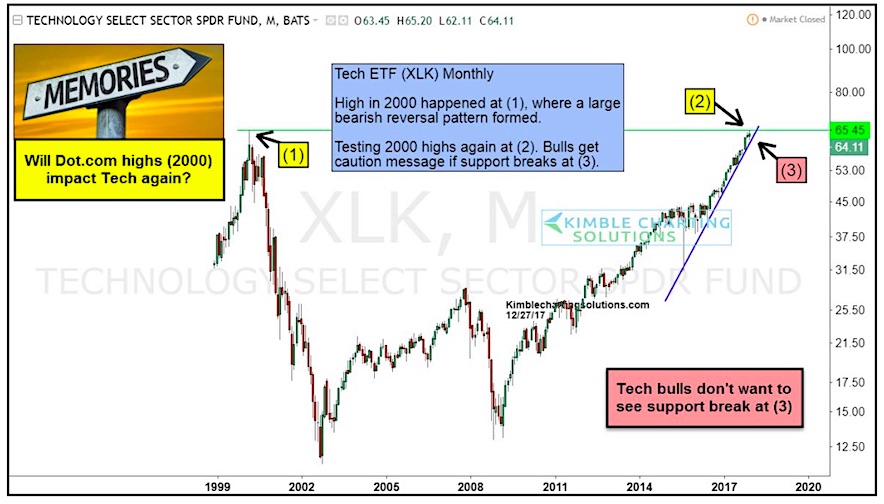
In the chart below, I’ve plotted the price action over the past 20 years in the Technology Sector ETF (XLK). You can see the 2000 highs at point (1) – just look at that bearish monthly candle stick. That top lead to a nearly 80 percent decline. Now move your eyes left to right… you can also see that the price of XLK is approaching those very 2000 highs – see point (2).
Technology sector bulls want XLK to break above this psychological resistance level. It’s been a market leader, and bulls don’t want to see it show weakness here.
ALSO READ: Dow Industrials Testing 261.8 Fibonacci Resistance
If this tech ETF breaks this year’s sharp uptrend, it could lead to the first market correction in several months. Investors should stay tuned.
Technology Select Sector ETF (XLK) “Monthly” Chart (1998-2017)
Twitter: @KimbleCharting
Any opinions expressed herein are solely those of the author, and do not in any way represent the views or opinions of any other person or entity.

 Rolling Over At Key Fibonacci Level?")


