
Today we have another look at the 23-month moving averages.
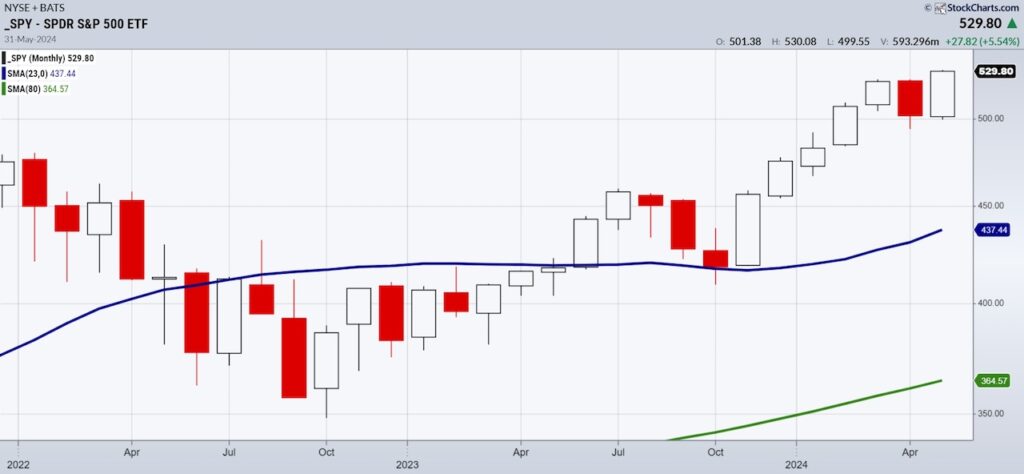
The first one for context is of the S&P 500 (SPY).
SPY cleared the 23-month in 2023.
SPY tested the 23-month moving average after the breakout in October 2023.
SPY closed today on new all-time highs.
One could say that SPY entered an expansion phase last year and is, well, still expanding.
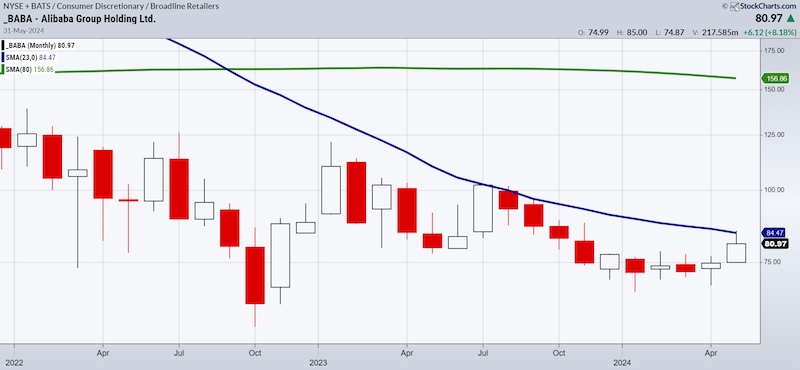
In contrast, the next chart is of Alibaba and its 23-month moving average.
We know that if the price clears that MA, then we will assume that the stock has more room to run with a now 2-year business cycle expansion.
Nonetheless, the stock fell after earnings and now we use the support level of $77-80 to gauge the company’s health.

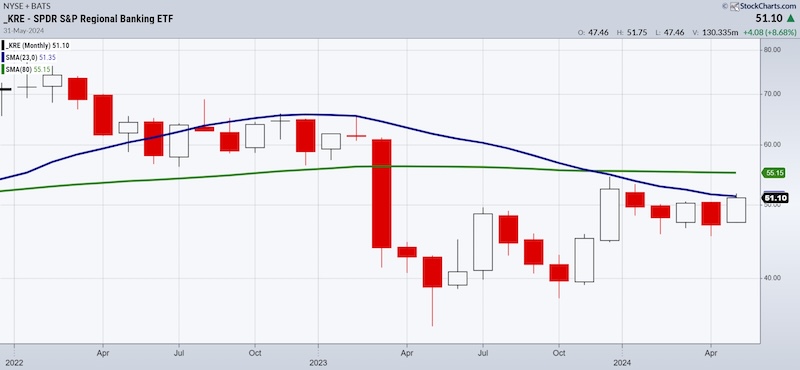
In 2023, KRE was the first sector in the Family to signal a warning in March.
That is when SPY fell to test its 23-month and held it, telling us that the bank debacle while a bit destabilizing, was not a buy opportunity against major support.
Presently, the 23-month MA sits at $51.30.
Today it traded to a high of 51.75, settling at 51.04 or just below the 23-month MA.
Hence, while KRE has been in contraction really since 2022, it now stands a chance of going into expansion.
We are not there yet, but keep your eyes on
- KRE holding $49-50.
- KRE closing the month over the 23-month MA and staying above there for a great low risk trade opportunity.
Twitter: @marketminute
The author may have a position in mentioned securities at the time of publication. Any opinions expressed herein are solely those of the author and do not represent the views or opinions of any other person or entity.


