I spent a lot of time this past week looking back across 2017. I reviewed some of my best charts and market/macro calls of the year (along with some of my worst!). I also reviewed some my favorite charts.
This article provides a look at some of the most important charts and indicators as we turn the page to 2018.
As interesting and sometimes even amusing as it is to look back in time, as investors we get paid for looking forward and anticipating what may come. In this respect there’s a few existing trends and themes that will remain front of mind for me and will be key to keep on your radar in 2018.
Following is a selection of the key charts and indicators we will be watching in the new year. The themes span inflation, monetary policy, commodities, China, emerging markets, corporate bonds, global equities, volatility, and bond yields. In other words, all the issues and topics that most active asset allocators should be thinking about. I’ll be covering these topics in more detail in the coming weeks.
I’ve said it before and I’ll say it again: 2018 is going to be harder and more complex for investors than 2017. The cross currents of rising valuations across asset classes, maturing of the business cycle at a global level, and the turning of the tides in monetary policy could make 2018 a watershed year.
That all said, here’s the charts! Best wishes and best of luck for 2018.
Chart #1 No more spare capacity in Developed Markets. (Next step = Inflation)
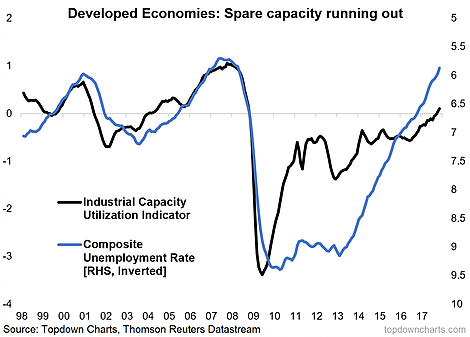
Chart #2 A secular bottom in 10-year bond yields looks to be on the cards.
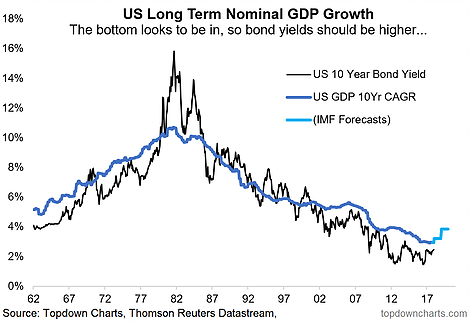
Chart #3 The monetary tides are going out. (be careful!)
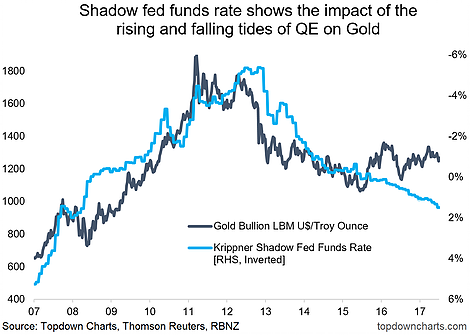
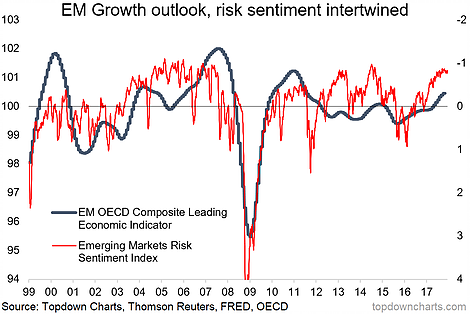
Chart #4 Emerging Markets cross-asset risk pricing is complacent/confident, and for now is engaged in a virtuous cycle as improving economics reinforce the relaxed risk perceptions.
continue with charts 5-10 on the next page…

: Showing Some Signs of Emerging Strength")

