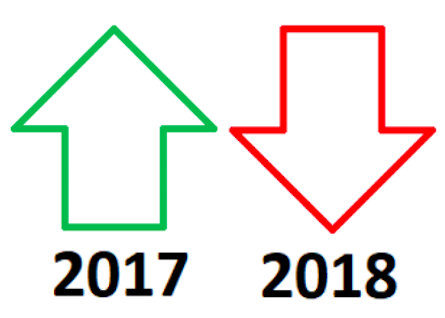
[VIDEO] This Year In Stocks: Will The Bear Awaken In 2018?
Earlier this week, we shared our weekly outlook and video. With stocks at all-time highs, there's high expectations for 2018.
But it's a good idea...
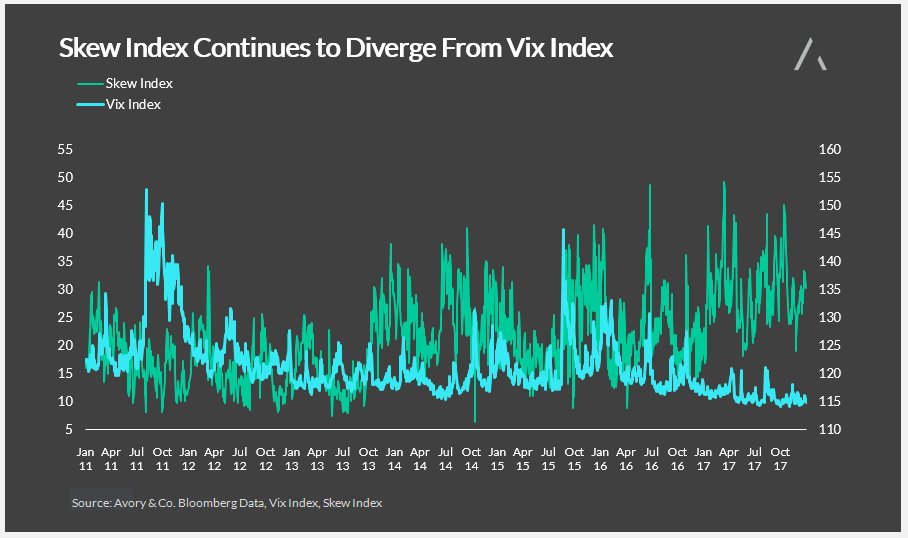
SKEW Index Continues To Diverge From VIX Index
The story of volatility has been very one-sided of late. There’s been low volatility despite various geopolitical headlines which in the past would have...
2018 Investment Outlook: Avoiding The Consensus
The following outlook provides our investment thoughts for the coming year - 2018.
We did not include specific recommended asset allocation weightings for the major...
S&P 500 Trading Outlook: Equities Rally Extended
S&P 500 Trading Outlook (2-3 Days): BULLISH
Yesterday's recovery of last week's decline suggests an upcoming push back to new highs is likely for equities. This...
2018 Market Outlook: What Can We Learn From 2017?
Stocks Can’t Keep Going Up, Right?
Given the S&P 500, Dow Industrials, and NASDAQ were all up over 10% in 2017, it might be tempting...
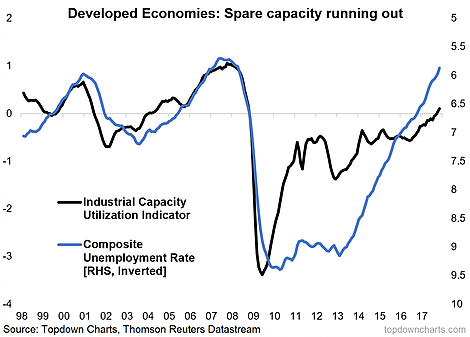
Top 10 Charts For Investors To Watch In 2018
I spent a lot of time this past week looking back across 2017. I reviewed some of my best charts and market/macro calls of...
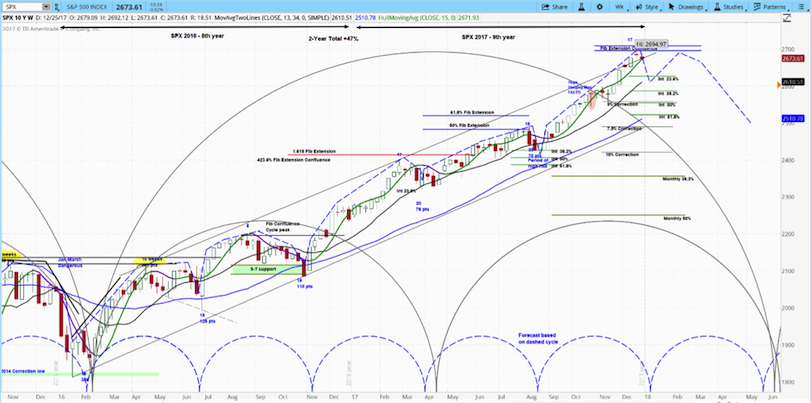
2018 Stock Market Cycles Outlook: New Highs… After A Dip
The stock market closed a positive chapter last week as 2017 saw the S&P 500 return 20 percent.
What will 2018 bring? Let's discuss what's...
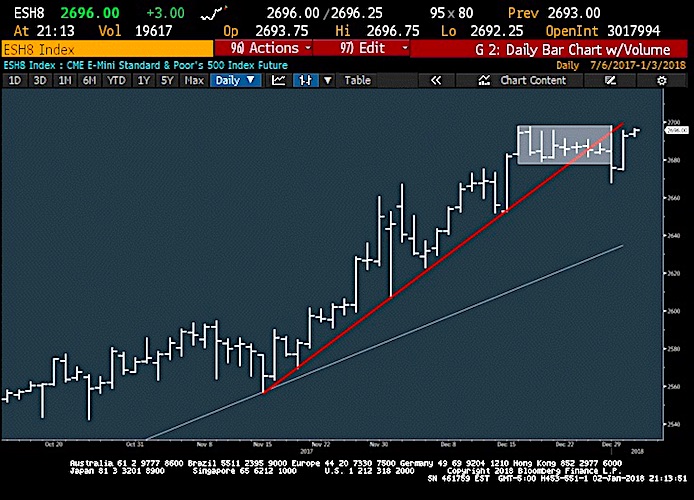
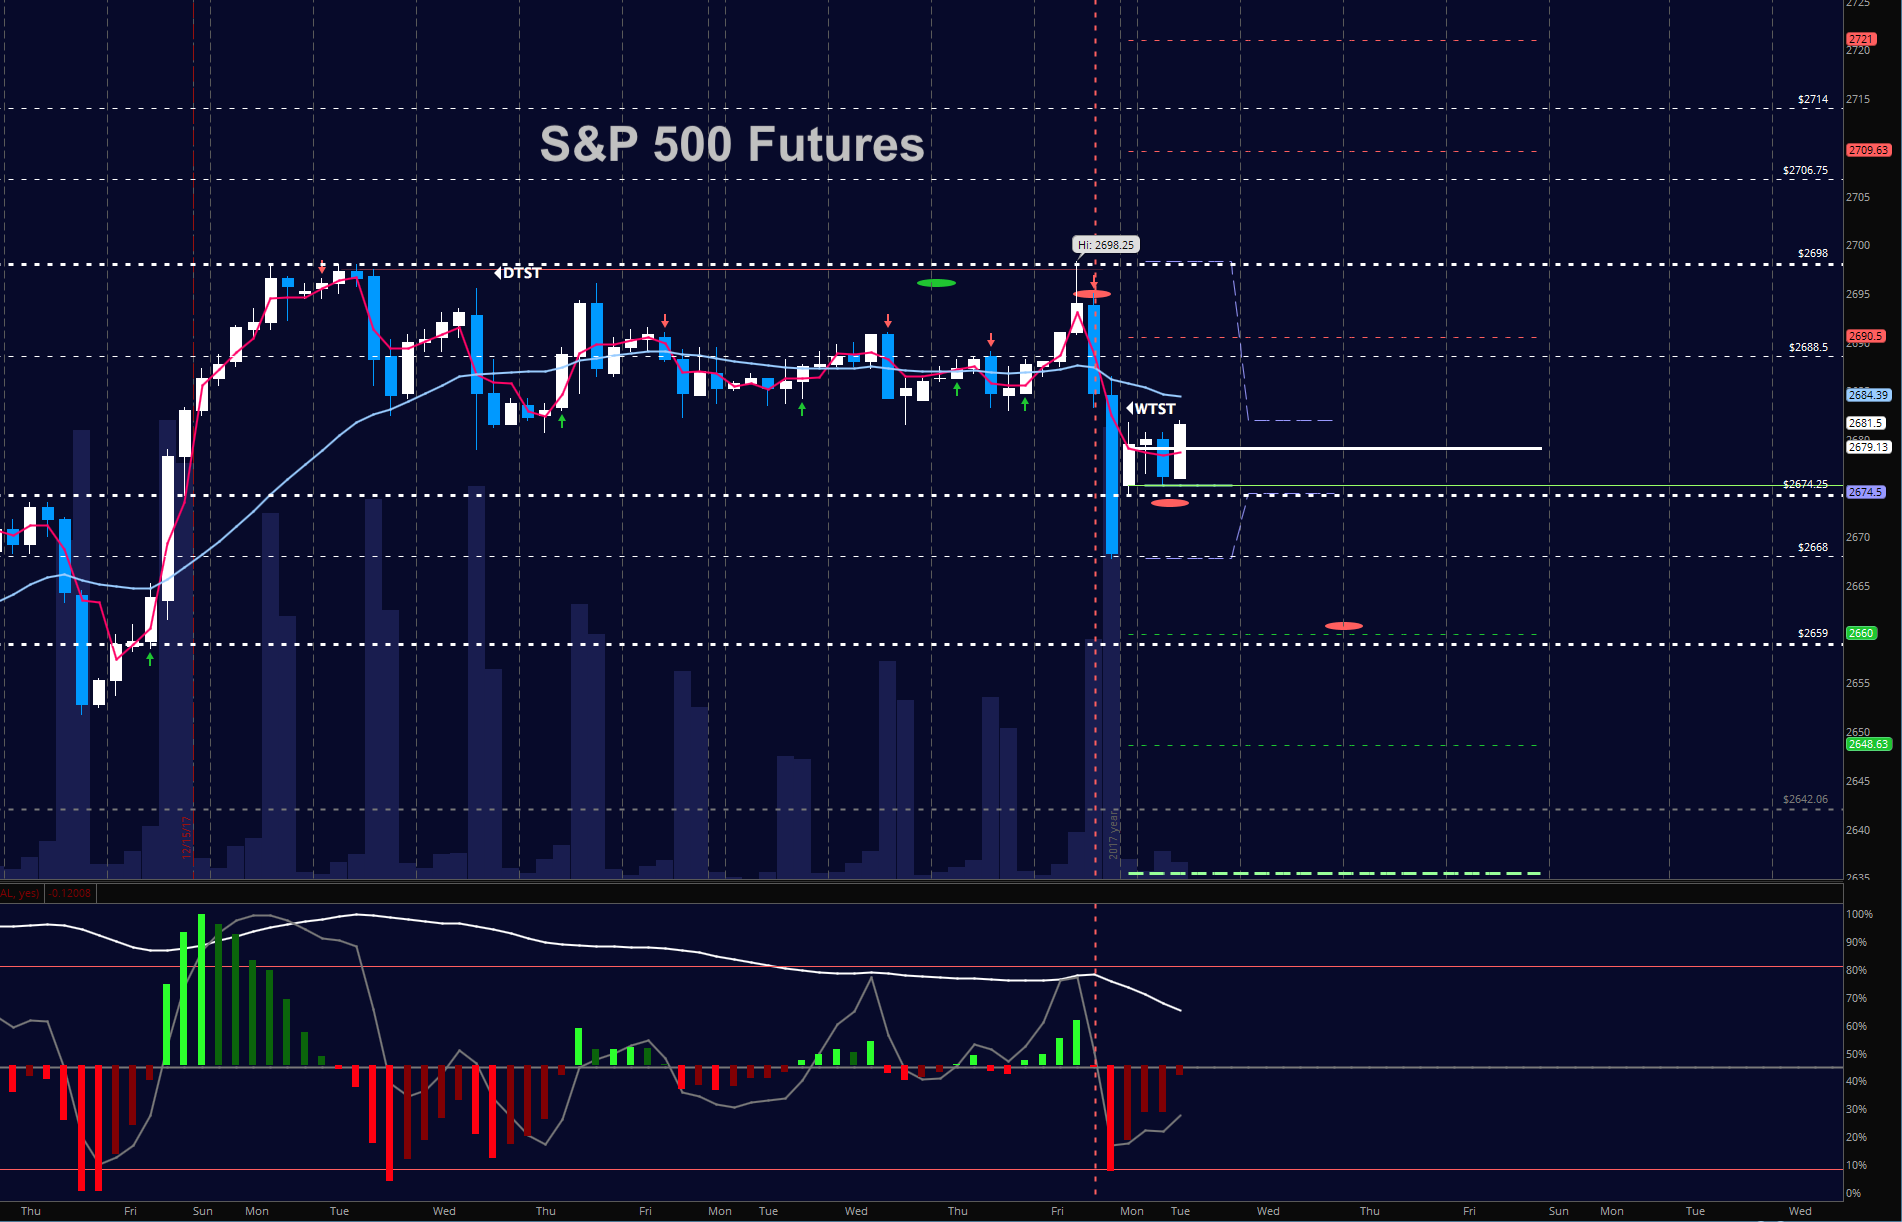
S&P 500 Futures Trading Update For January 2, 2018
A review of the last post shows S&P 500 futures support targets near 2671.25 were tested and then recaptured.
This is customary in bullish environments.
S&P...
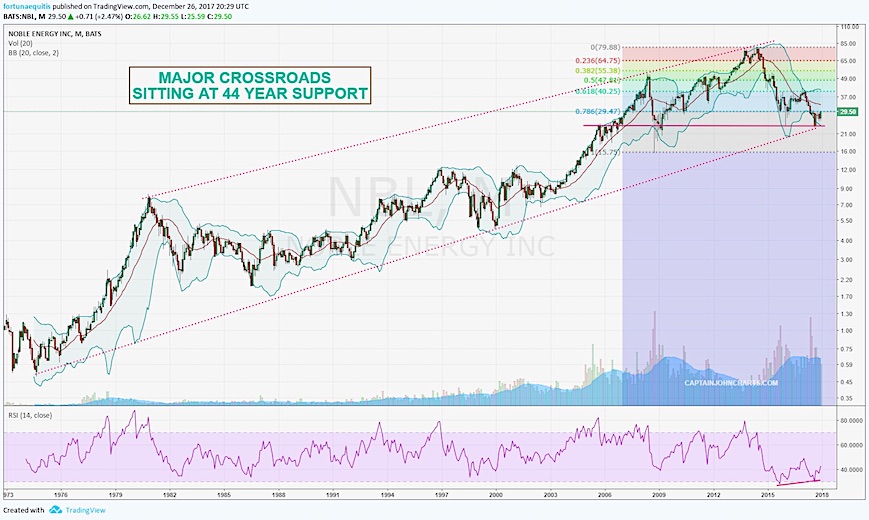
Noble Energy Stock Bouncing Off 44 Year Price Support
In October, I explored the technical analysis of Noble Energy's monthly stock chart (NBL) and the important technical signals it was sending to investors....
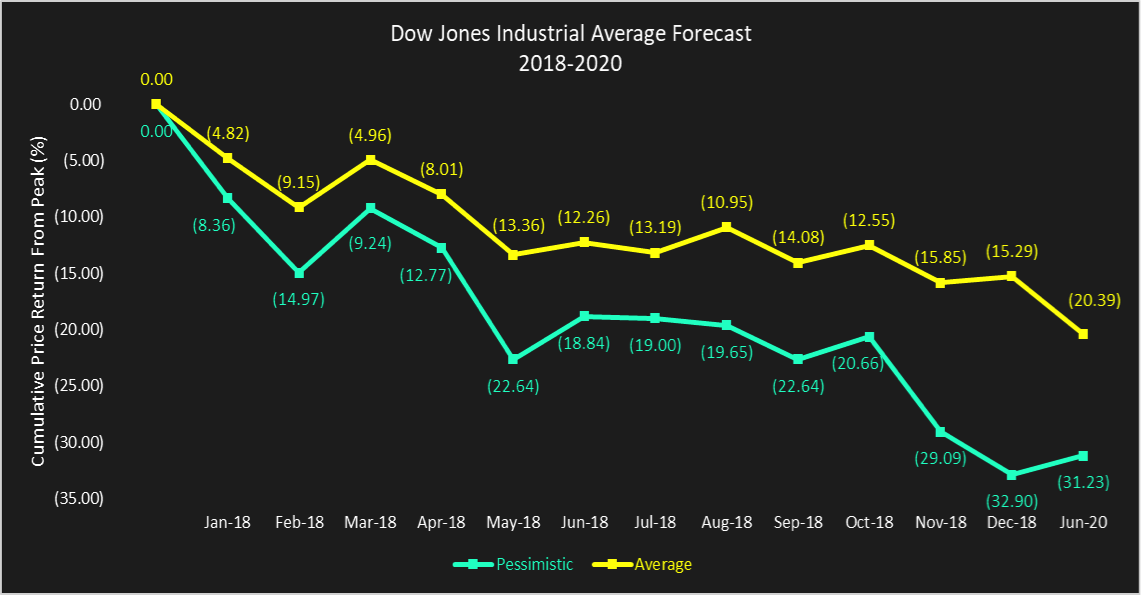
Dow Jones Industrial Average Forecast: Years 2018 to 2020
“TIME is the most important factor in determining market movements and by studying the past records of averages or individual stocks you will be...

![[VIDEO] This Year In Stocks: Will The Bear Awaken In 2018?](https://www.seeitmarket.com/wp-content/uploads/2018/01/ask-slim-image.png)
