Stocks Can’t Keep Going Up, Right?
Given the S&P 500, Dow Industrials, and NASDAQ were all up over 10% in 2017, it might be tempting to think stocks will struggle for gains in 2018. Therefore, it is prudent to see what we can learn from market history.
What Happened The Following Year?
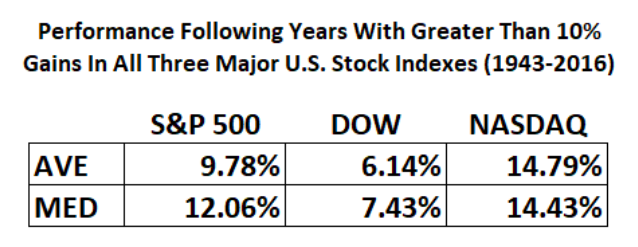
Since 1944, there have been 34 years the S&P 500, Dow Industrials, and NASDAQ all posted gains of 10% or better (the NASDAQ comes into the equation in the early 1970s).
The table below shows what happened the following year…
Were Charts Helpful In 2017?
The question in the header above is like asking is a golf club helpful in the game of golf? The answer depends on how the golf club is used. Charts, indicators, and ratios are tools that can be used effectively or ineffectively, just like a golf club.
This week’s stock market video looks back at charts presented throughout 2017, allowing us to answer the question, can charts be used as an effective tool in the realm of investing? You can decide after reviewing the video with dated clips.
“People think that technical analysis is unreliable because they tend to pick the one thing they are comfortable with. The problem is that no single technical approach works all the time. You have to know when to use each method.” – Ed Weinstein, Market Wizards
Thanks for reading.
Twitter: @CiovaccoCapital
The author or his clients may hold positions in mentioned securities at the time of publication. Any opinions expressed herein are solely those of the author, and do not in any way represent the views or opinions of any other person or entity.


