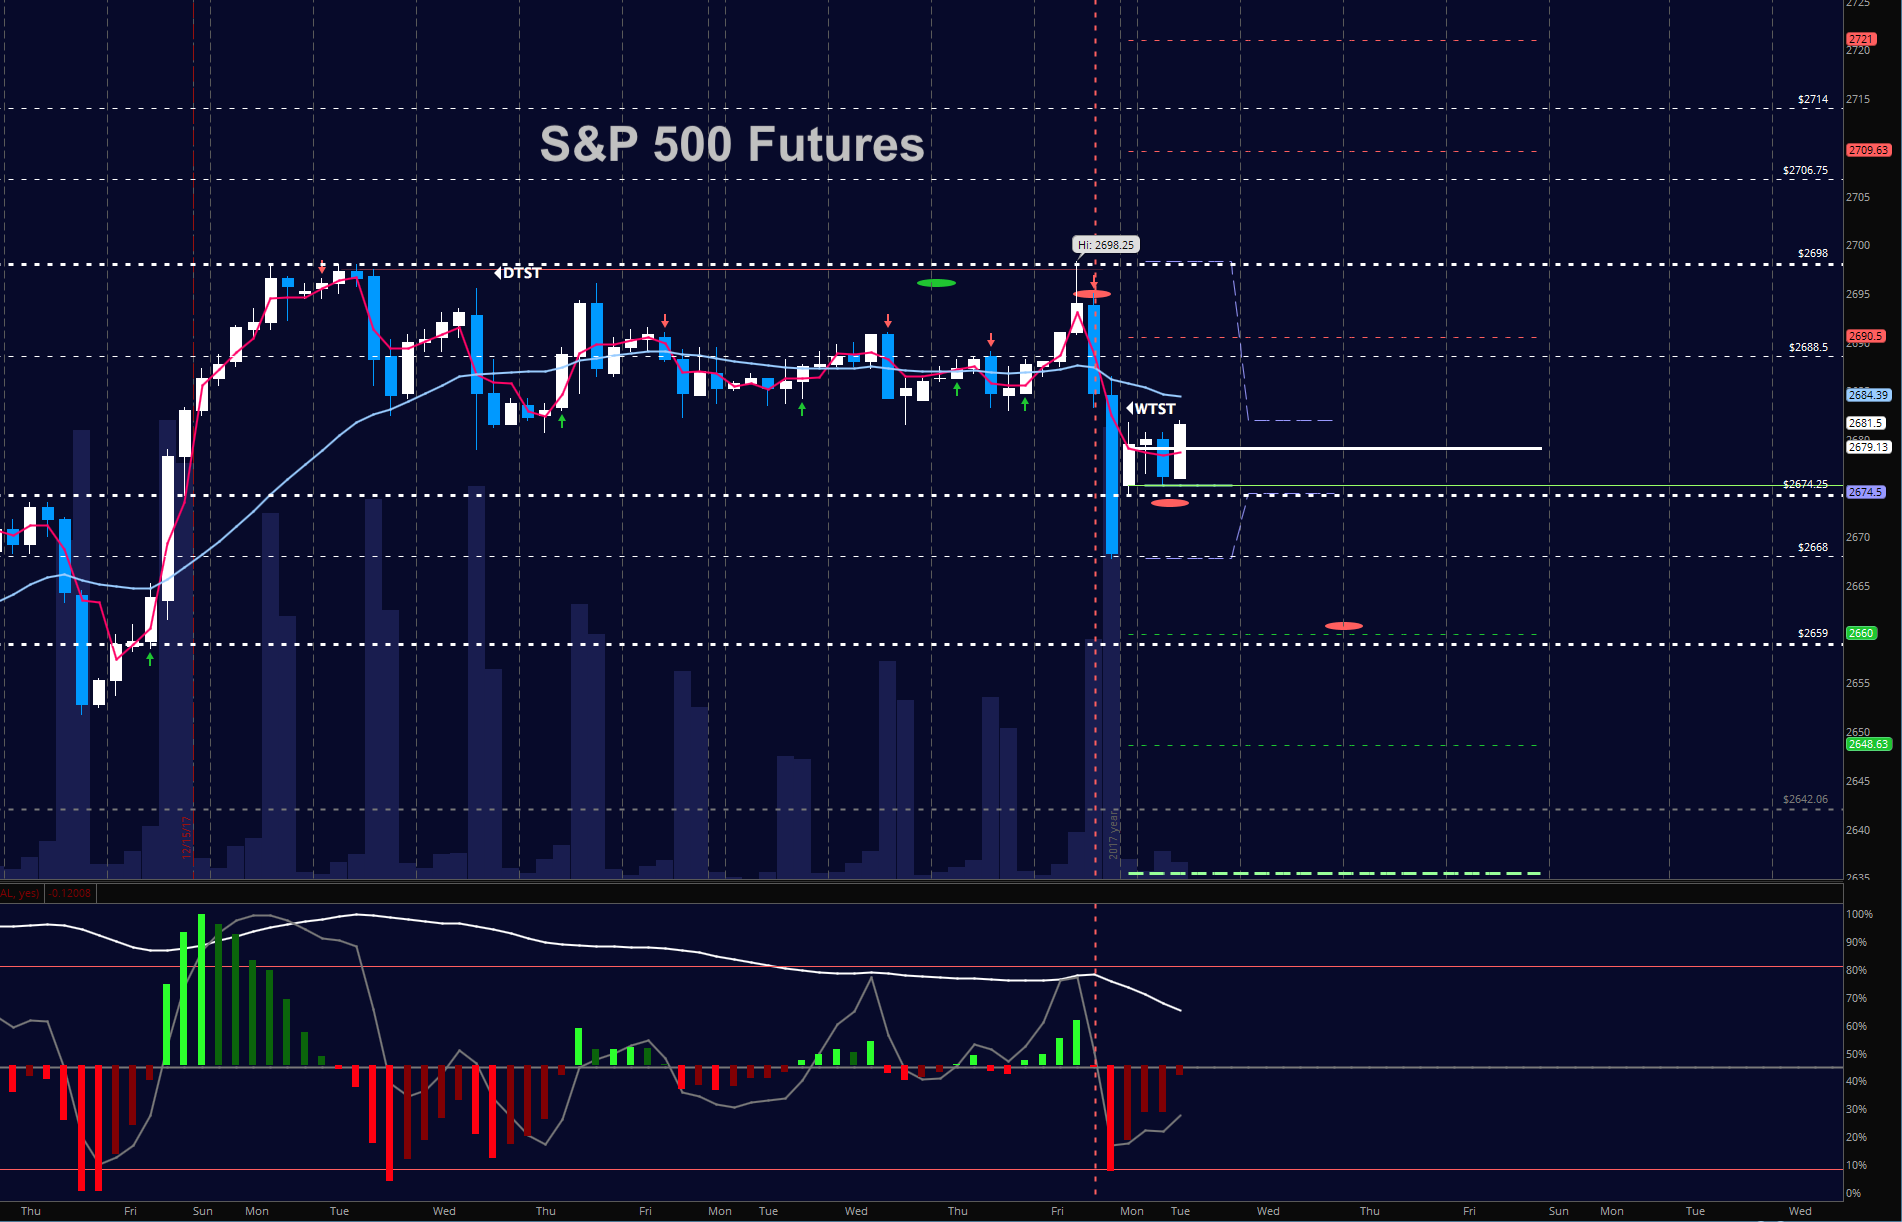
A review of the last post shows S&P 500 futures support targets near 2671.25 were tested and then recaptured.
This is customary in bullish environments.
S&P 500 Futures Trading Considerations For January 2, 2018
Value buyers will come in to participate at less elevated prices. We have a bit of negative momentum ahead and though we are set to bounce, it is likely that our bounces into the 2690 region will fail to hold at the first pass today (probabilistically speaking, that is).
We broke below our rangebound pattern between 2679 and 2696 and traders will now test the 2682 region to challenge sellers in the area. The bullets below represent the likely shift of trading momentum at the positive or failed retests at the levels noted.
- Buying pressure intraday will likely strengthen with a positive retest of 2690.5
- Selling pressure intraday will likely strengthen with a failed retest of 2678.5
- Resistance sits near 2684.5 to 2690.25, with 2696.75 and 2706.75 above that.
- Support holds between 2679.5 and 2674.5, with 2668.25 and 2658.75 below that.
NASDAQ Futures
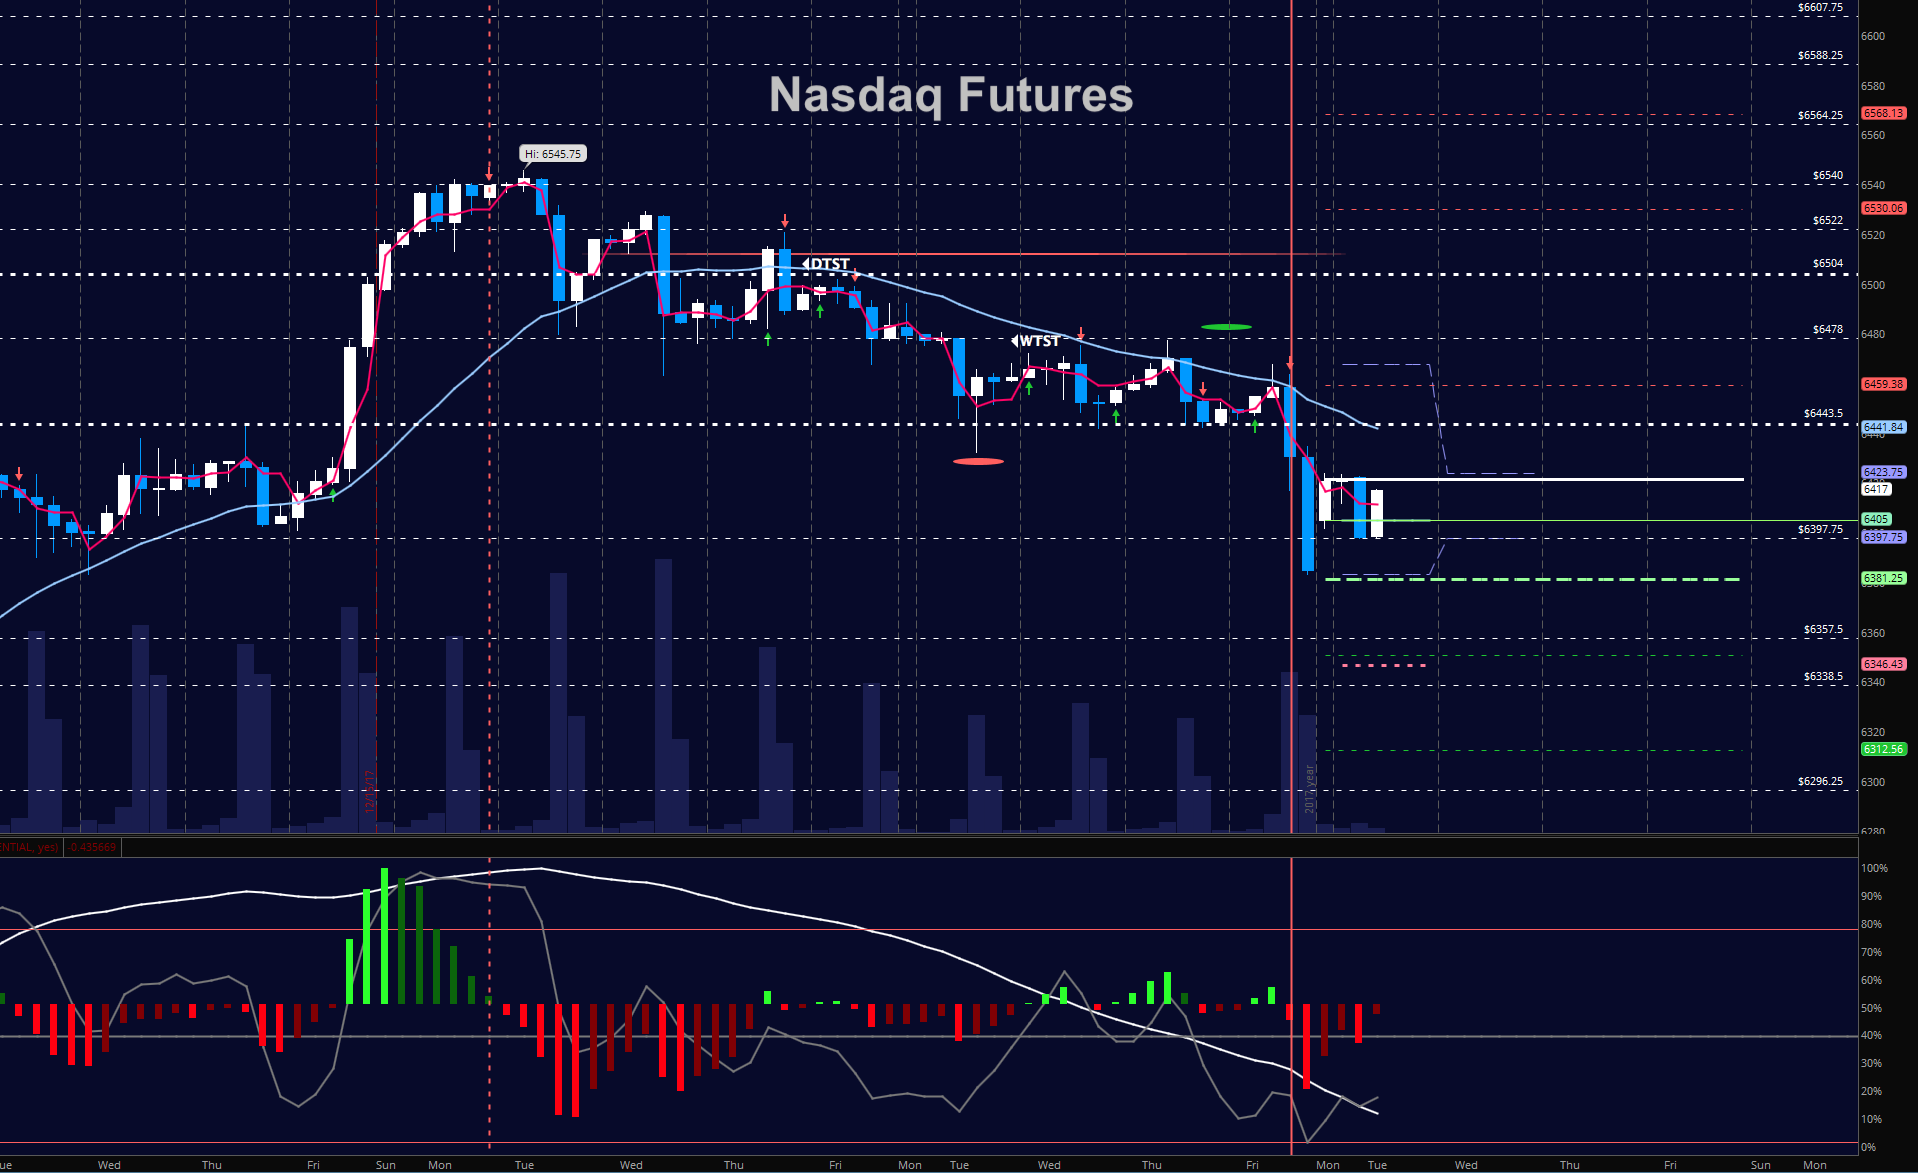
After an attempt at recapturing old highs in the last two weeks of December, the NQ_F is buckling under its own weight with buyers participating only to the levels of prior broken supports. Though we are in a clear intraday bounce pattern in the early morning it is most likely that our traders will fail to hold regions above 6443 today. However, the hold of this level near 6443 will shift the tide back to buyers intraday, so watch this region as it could give us more recovery upside. The bullets below represent the likely shift of intraday trading momentum at the positive or failed tests at the levels noted.
- Buying pressure intraday will likely strengthen with a positive retest of 6453.75
- Selling pressure intraday will likely strengthen with a failed retest of 6397
- Resistance sits near 6423.5 to 6441.5 with 6459.25 and 6478.75 above that.
- Support holds near 6405.5 and 6385.75, with 6357.5 and 6338.5 below that.
WTI Crude Oil
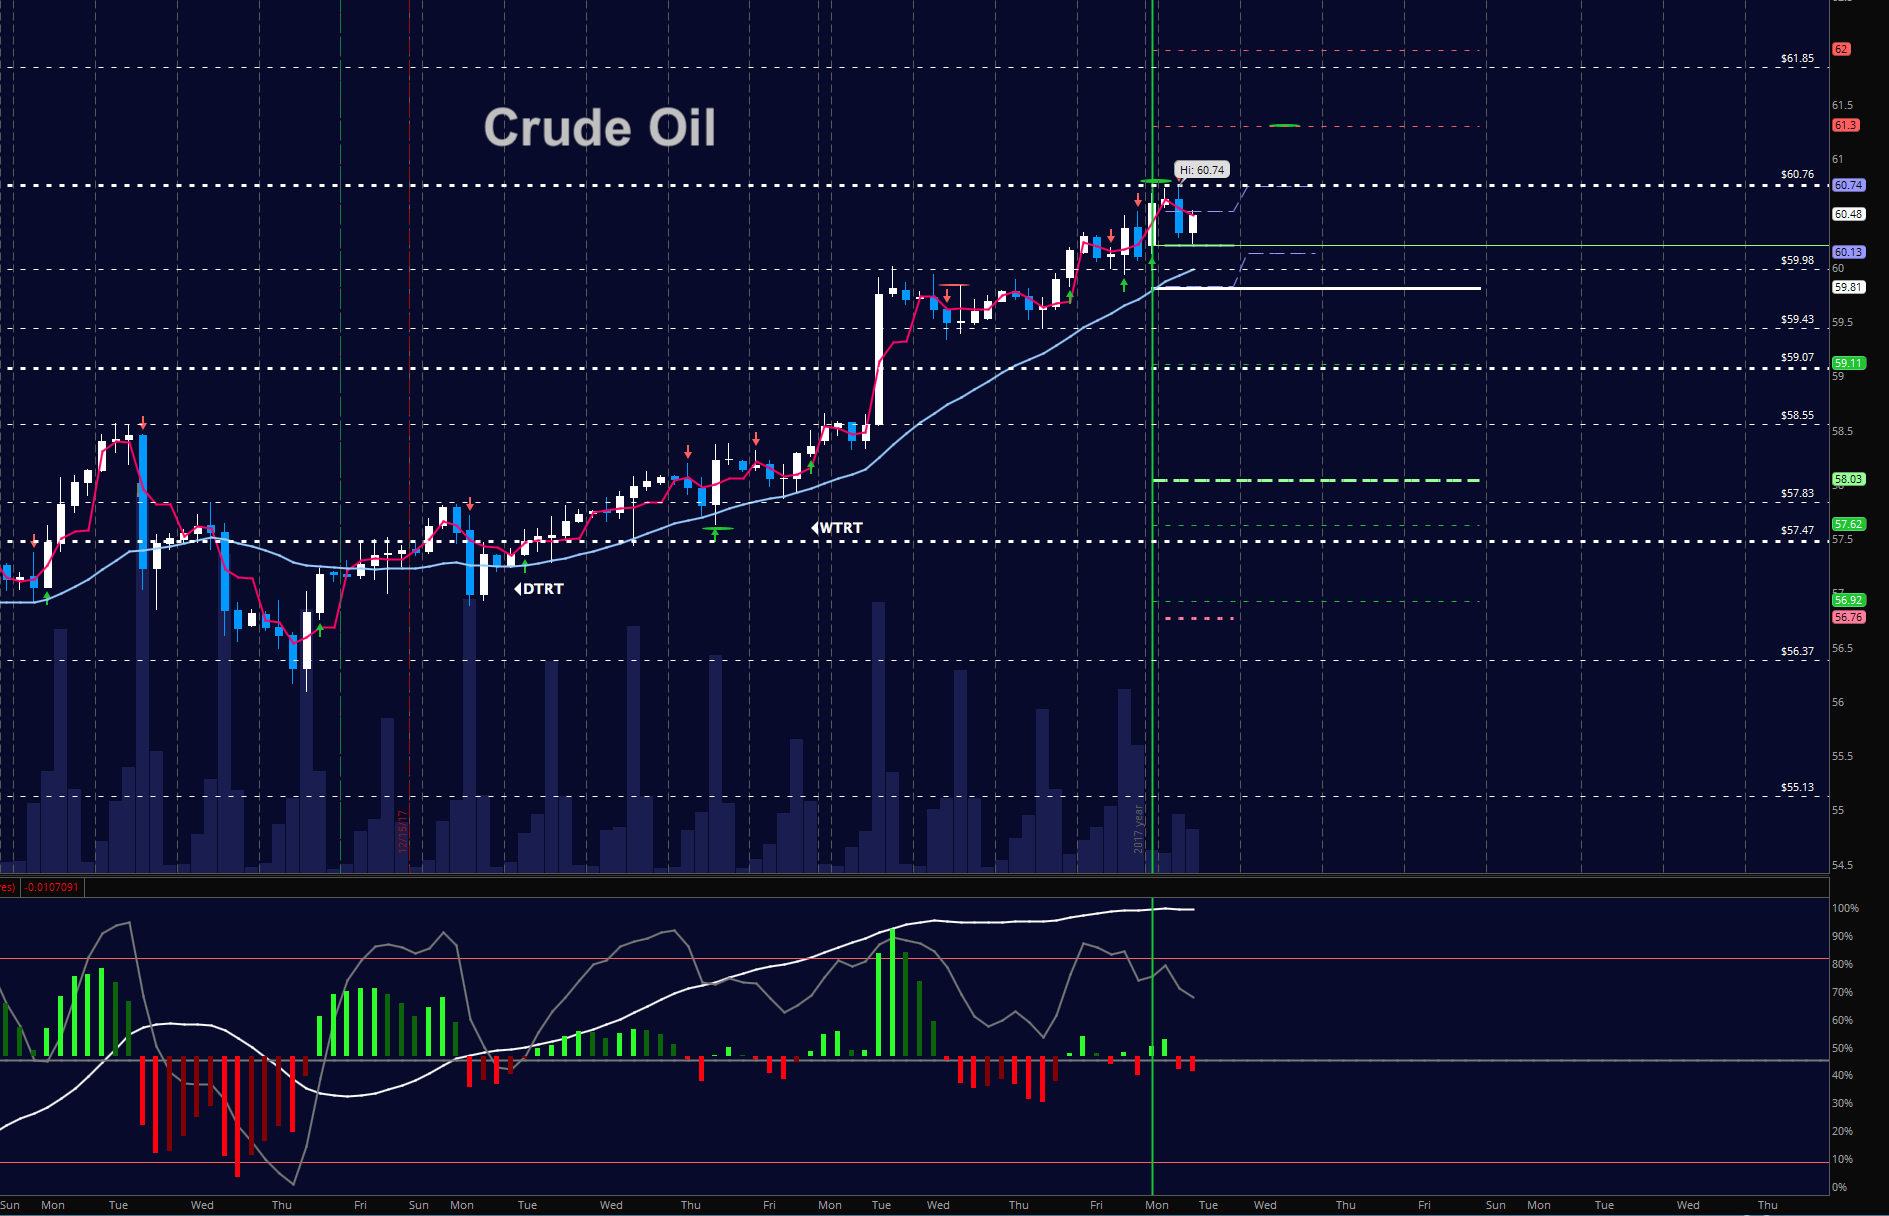
A test of the highs near 60.7 that last appeared more than two years ago occurred in the overnight and brought with it sellers ready to participate in profit taking and/or early shorting. Traders are clearly in a much more bullish stance concerning the WTI contracts here but participation long at these levels will expose us to higher risks that if we wait to see support tests near 59 unfold. The bullets below represent the likely shift of trading momentum at the positive or failed tests at the levels noted.
- Buying pressure intraday will likely strengthen with a positive retest of 60.76
- Selling pressure intraday will strengthen with a failed retest of 59.77
- Resistance sits near 60.4 to 60.76, with 61.32 and 61.85 above that.
- Support holds near 60.17 to 59.77, with 59.29. and 58.55 below that.
If you’re interested in the live trading room, it is now primarily stock market futures content, though we do track heavily traded stocks and their likely daily trajectories as well – we begin at 9am with a morning report and likely chart movements along with trade setups for the day.
As long as the trader keeps himself aware of support and resistance levels, risk can be very adequately managed to play in either direction as bottom picking remains a behavior pattern that is developing with value buyers and speculative traders.
Twitter: @AnneMarieTrades
The author trades stock market futures every day and may have a position in mentioned securities at the time of publication. Any opinions expressed herein are solely those of the author, and do not in any way represent the views or opinions of any other person or entity.


