Bond Market Update: Glimpses Of A Maturing Business Cycle?
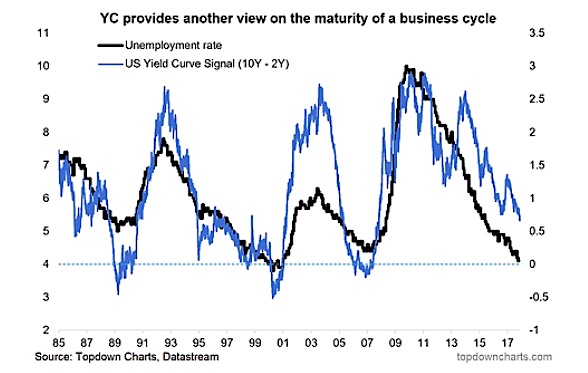
Lots of talking heads are pointing to a lower yield curve as a warning sign. While the yield curve is relatively good indicator for...
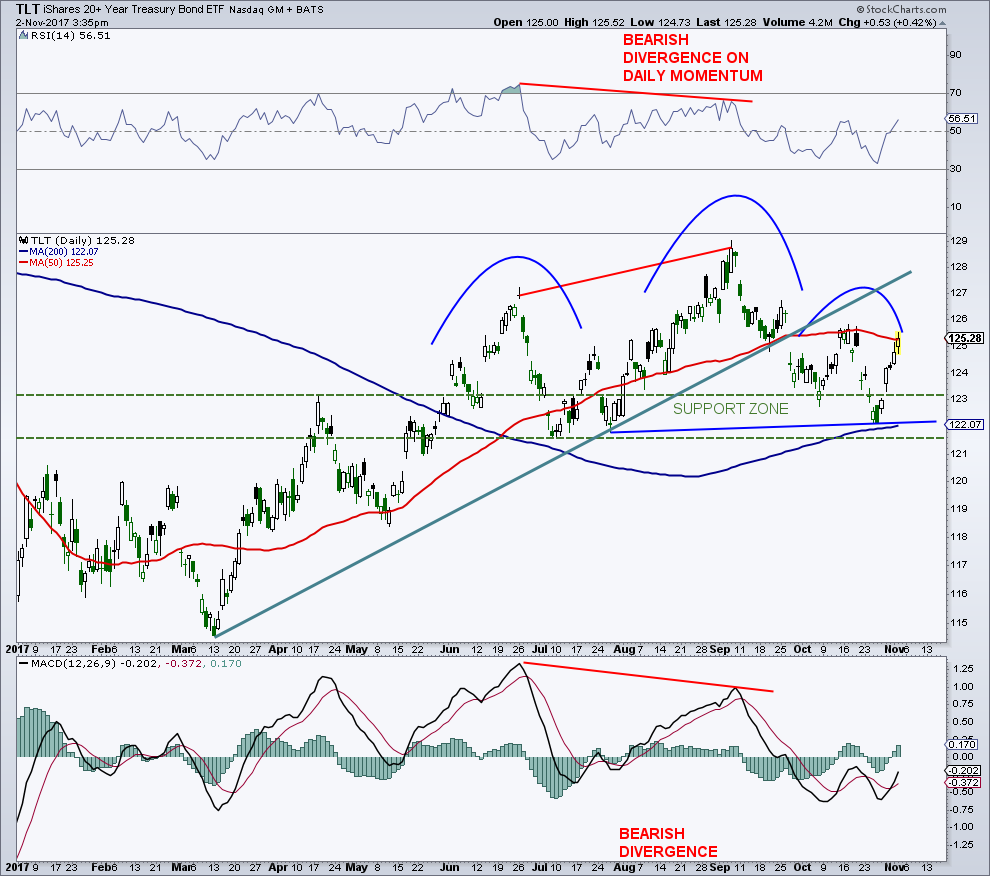
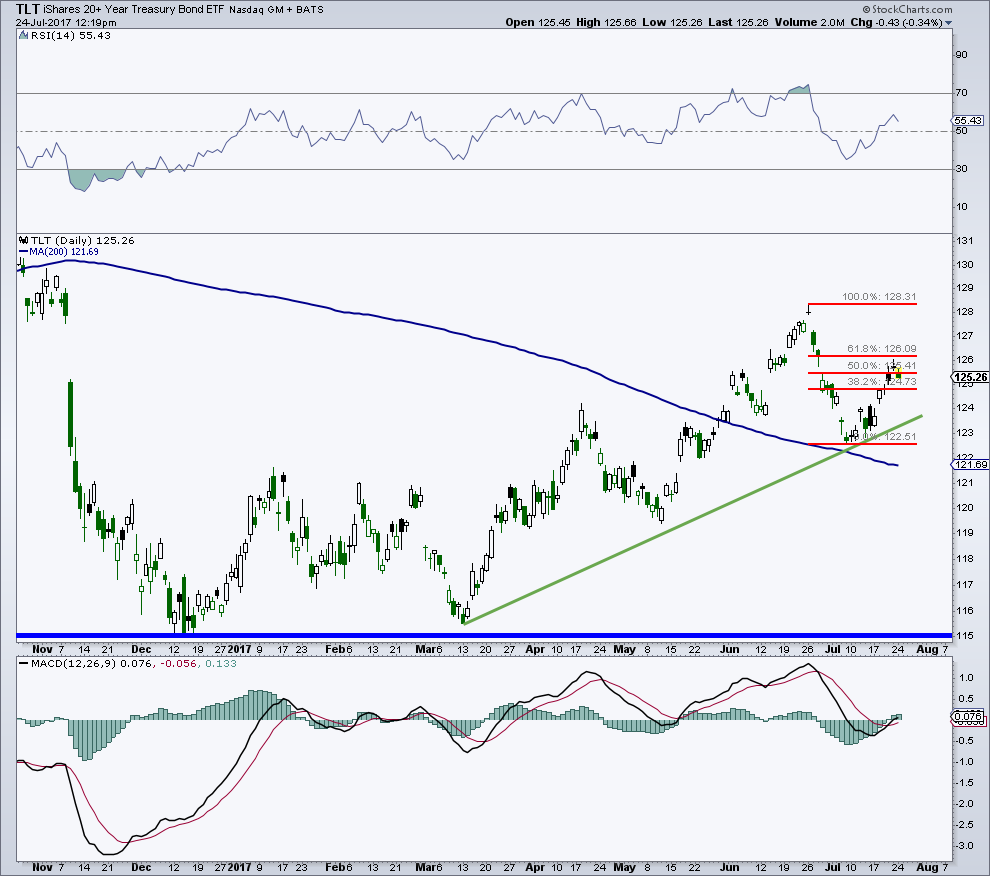
Treasury Bond ETF (TLT) Chart: Something For Bulls & Bears
The iShares 20+ Year Treasury Bond ETF (NASDAQ:TLT) is rallying off key lateral price support.
This bounce has neutralized the immediate bearish case... but it...
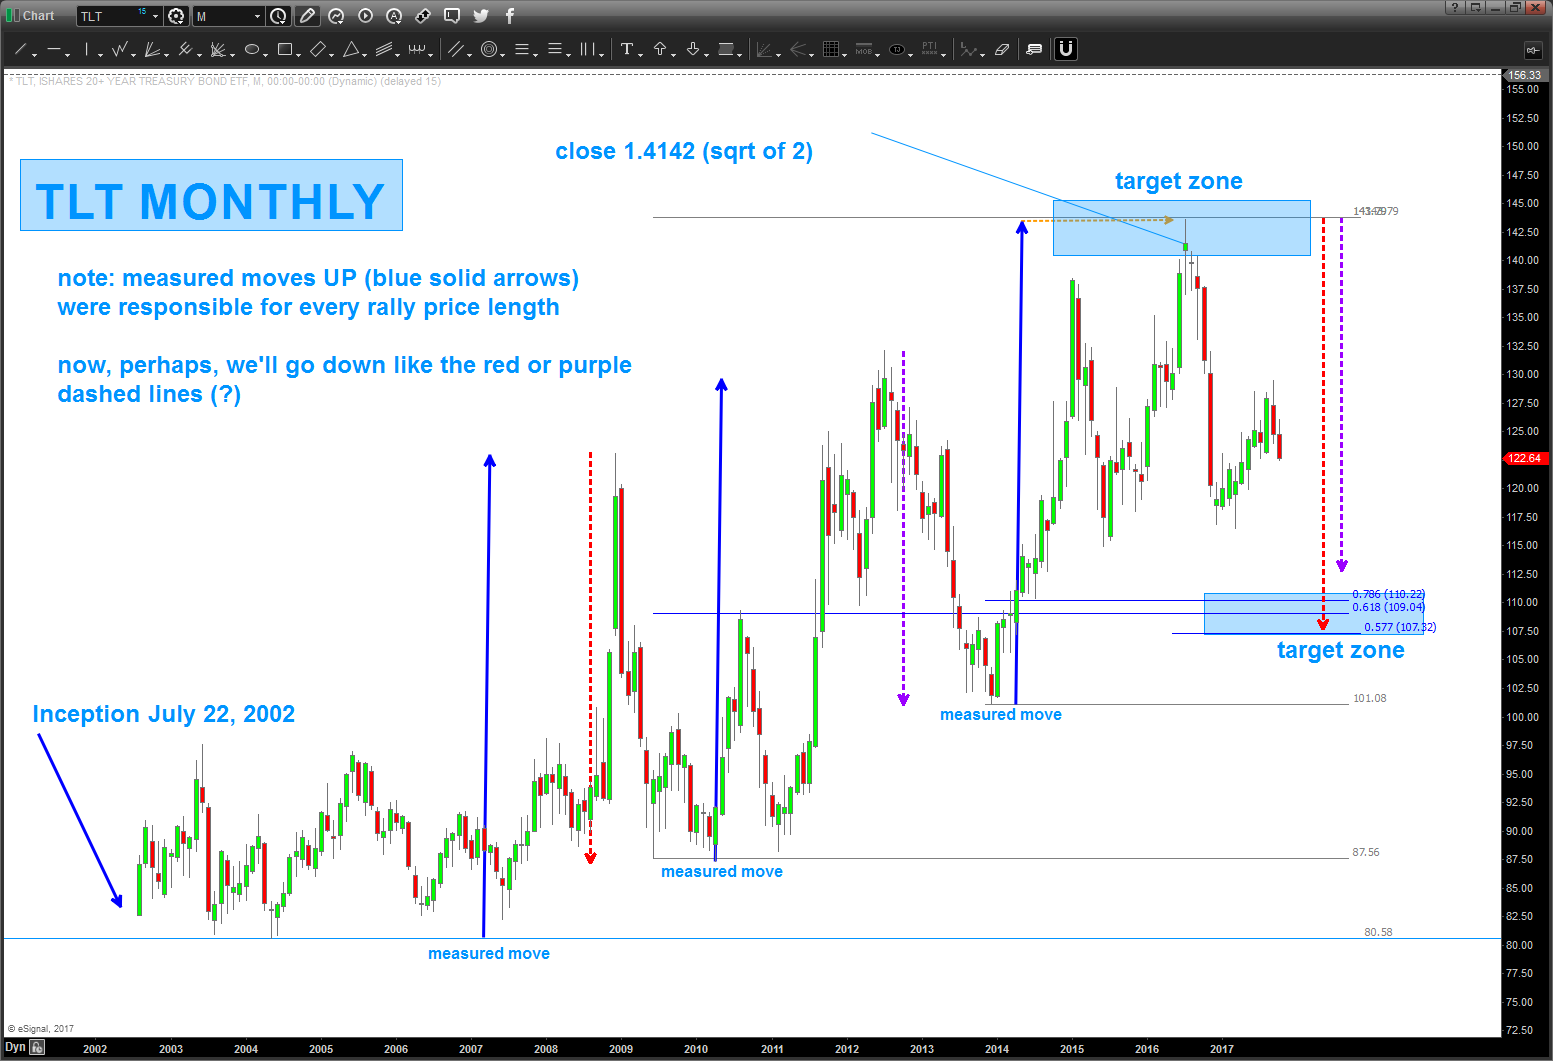
Is The Popular Treasury Bonds ETF (TLT) Headed Lower Yet?
In July of 2016 I discussed how the chart patterns were suggesting the popular 20 Year+ Treasury Bond ETF (NASDAQ:TLT) was about to hit...
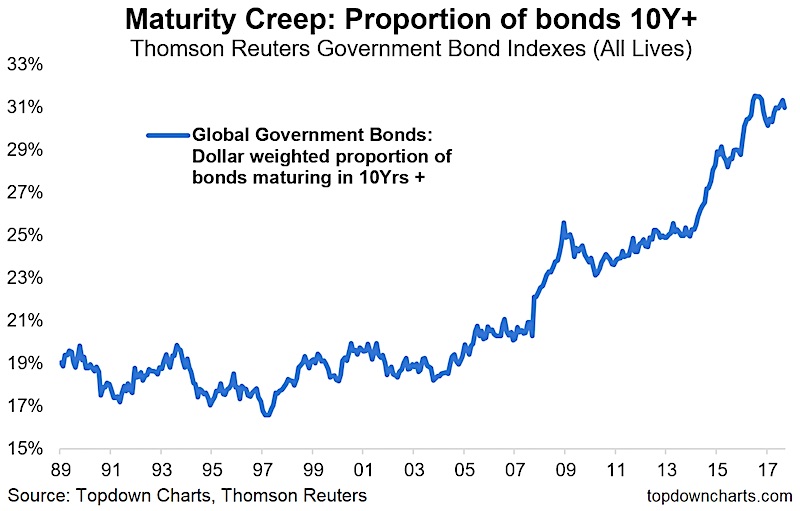
Maturity Creep – A Key Trend For Global Bond Investors
I was looking through some statistics on the global government bond markets, specifically the Thomson Reuters Government Bond Indexes.
A couple of key metrics and...
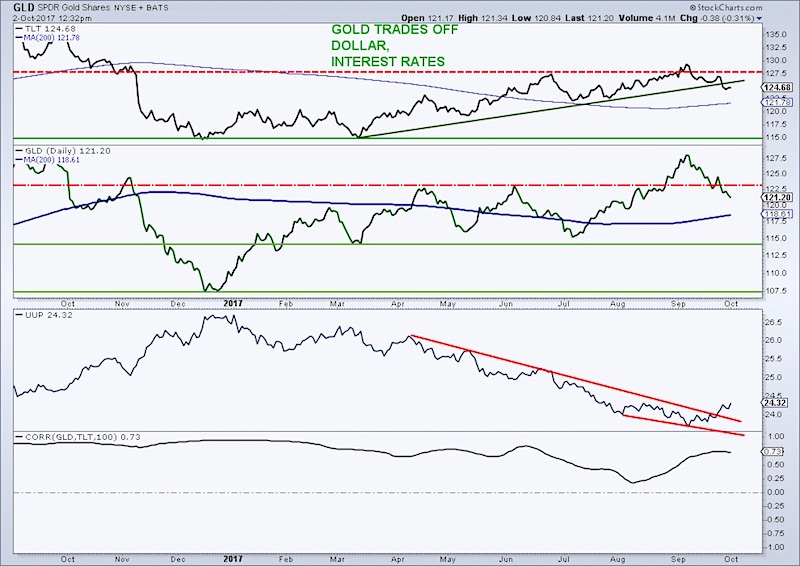
Gold Chart Spotlight: Bulls On The Ropes…
iShares Gold Trust (NYSEARCA:GLD) Analysis & Outlook:
Our steadfast bearishness toward the yellow metal, even as the world turned bullish, is paying off.
Gold prices (GLD)...
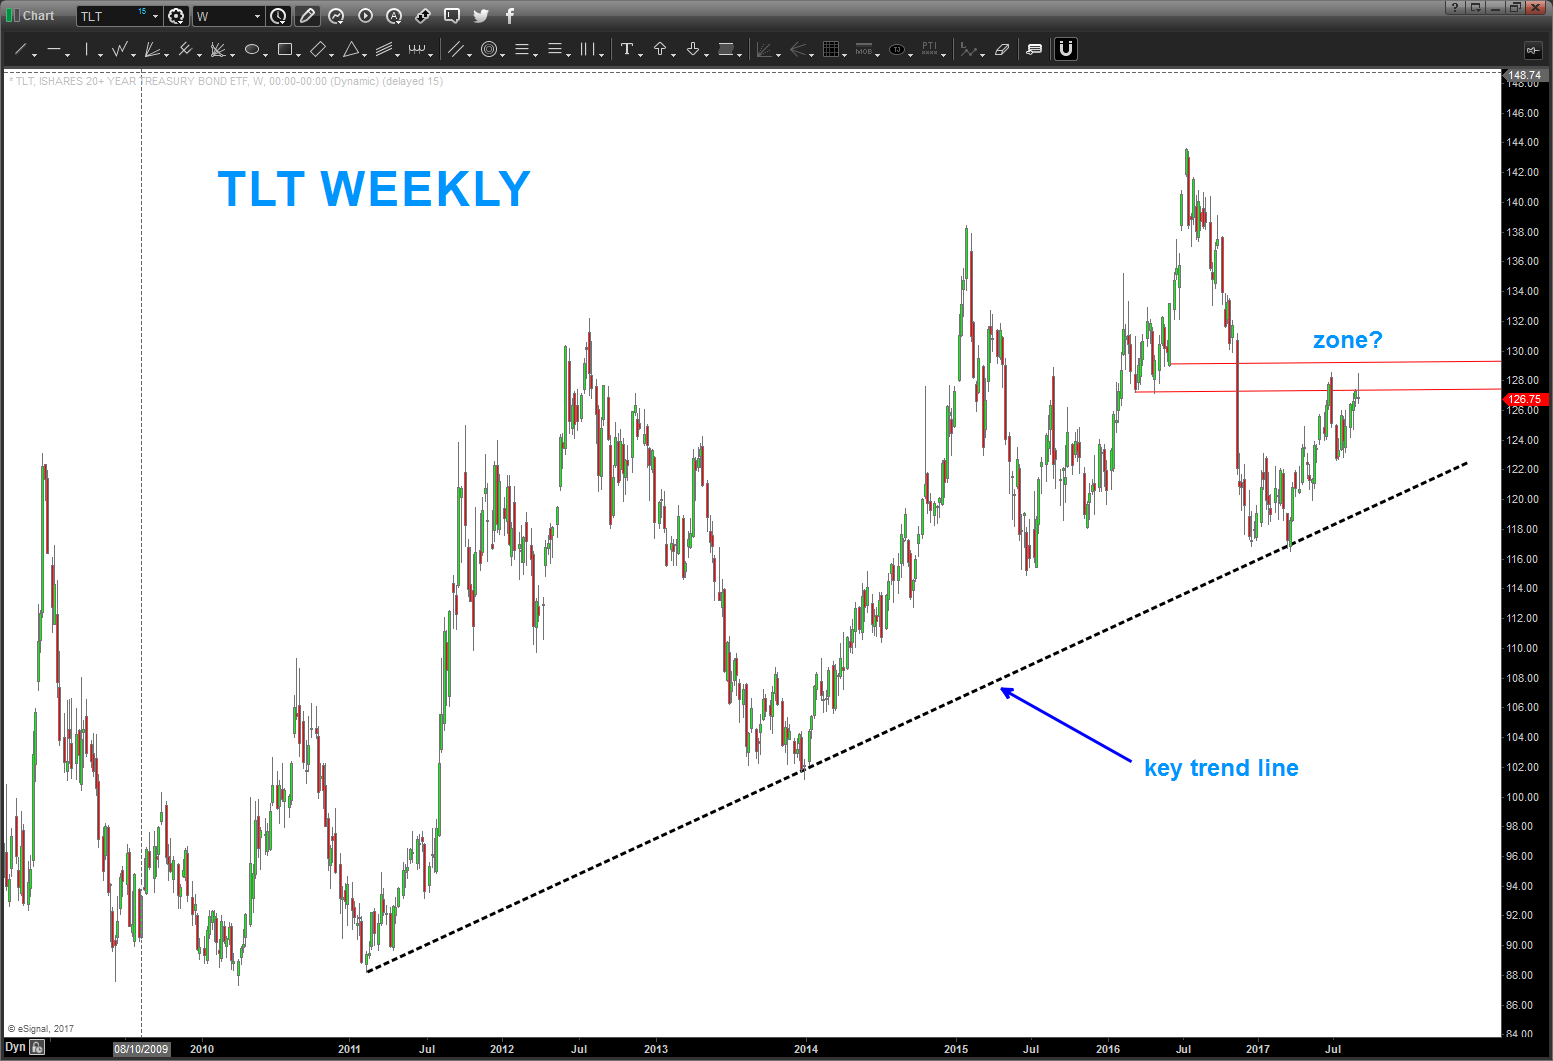
Treasury Bonds Rally Nears Key Price Resistance Area
In my last update on the 20+ Year Treasury Bond ETF (NASDAQ:TLT) and broader bond market, I highlighted the case for a deeply oversold...
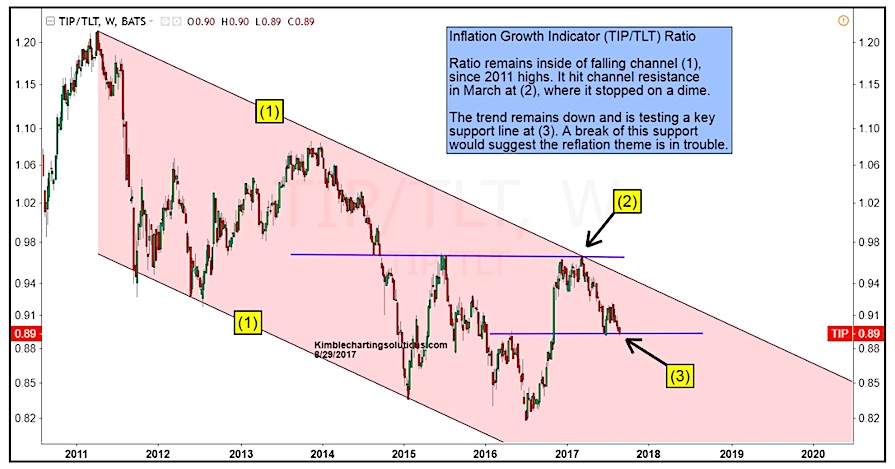
Key Inflation Gauge Testing Merits Of Reflation Theme
Back in June, we took a look at a key inflation gauge and pointed out why the reflation theme wasn't quite ready for primetime just...
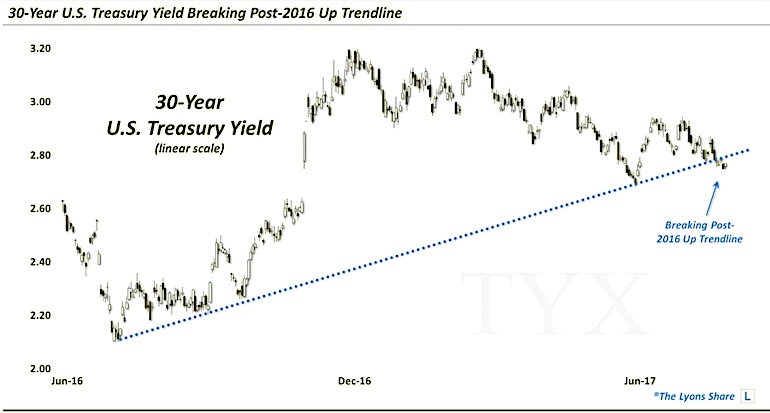
Chart Spotlight: U.S. Treasury Yields Under Pressure
As many of you know, I like to share charts that on trend lines. Whether price is testing, retesting, breaking out, or breaking down...
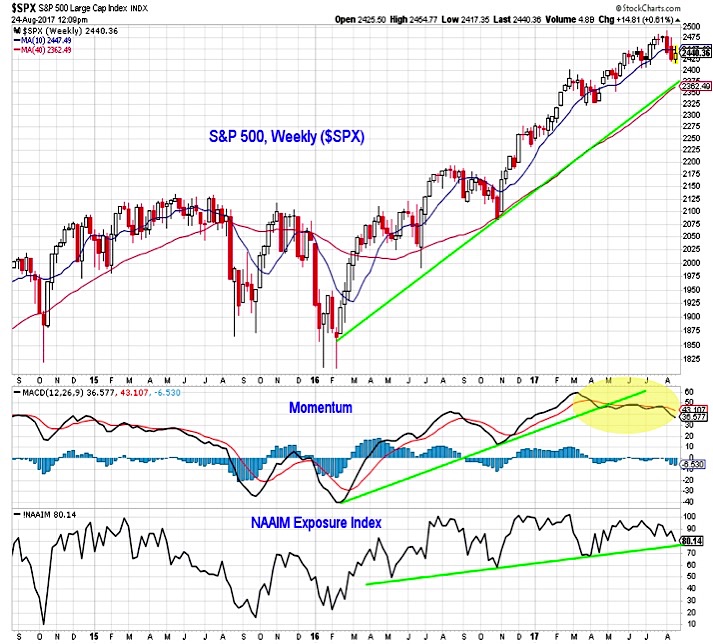
S&P 500 Weekly Market Outlook: Momentum Wavering
In this week’s investing research outlook, we analyze the technical setup and trends of the S&P 500 Index (INDEXSP:.INX), check in on investor sentiment and market...
Treasury Bond Rally (TLT) Runs Into Key Price Resistance
A couple weeks ago, I wrote that I was looking for a bond market rally to short. Particularly on the iShares 20+ Year Treasury...

