As many of you know, I like to share charts that on trend lines. Whether price is testing, retesting, breaking out, or breaking down through a trend line, there’s a lot to be gleaned from them.
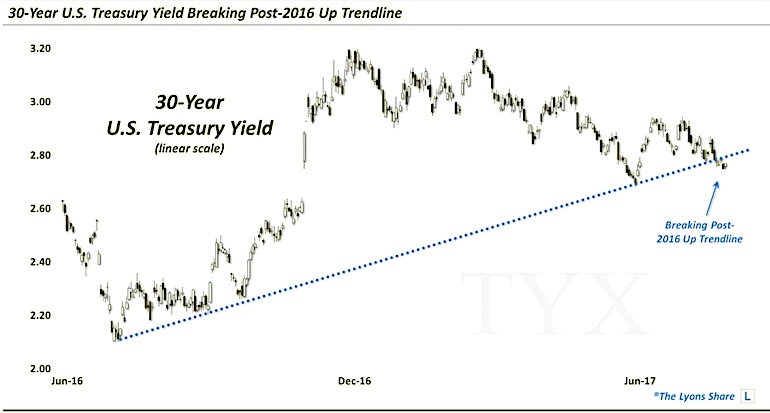
Further, the 30 Year U.S. Treasury Yield (INDEXCBOE:TYX) is attempting to break through its up-trend line.
So why is this important?
A breakdown in trends often signals a loss of momentum and typically a period of heightened risk for those betting with the trend (prior to it being broken). As for yields, they not only effect the treasury bond price but they often give us clues about the economy and broader economic outlook.
As you can see in the chart below, the 30 Year U.S. Treasury Bond Yield is attempting to break down through support.
Bond bulls (on price) are looking to push yields lower, while bond bears are in need of a quick reversal and recoup of the trend line.
30 Year U.S. Treasury Bond – Breaking Its Uptrend Line?
It’s also worth noting that the 10 Year U.S. Treasury Bond Yield (INDEXCBOE:TNX) broke down through its uptrend support some time ago. But as you can see in the chart shared today on See It Market’s twitter feed, it hasn’t violated its breakaway gap the same way that the 30 year yield has (compare the two charts). This leaves a small opening for yields to recover a bit. But the technical damage is notable.
$TNX 10-Year Treasury Yields holding above breakaway gap zone… stay tuned. pic.twitter.com/Rdt8H2jlYk
— See It Market (@seeitmarket) August 26, 2017
In any event, yields have been under pressure and may be sending a message to investors… Thanks for reading.
Twitter: @JLyonsFundMgmt
The author may have a position in mentioned securities at the time of publication. Any opinions expressed herein are solely those of the author, and do not in any way represent the views or opinions of any other person or entity.

: Showing Some Signs of Emerging Strength")
