In my last update on the 20+ Year Treasury Bond ETF (NASDAQ:TLT) and broader bond market, I highlighted the case for a deeply oversold market and targeted areas to go long and ‘expect’ a rally.
Here’s a link to that article: Long Duration Treasury Bonds Are Deeply Oversold
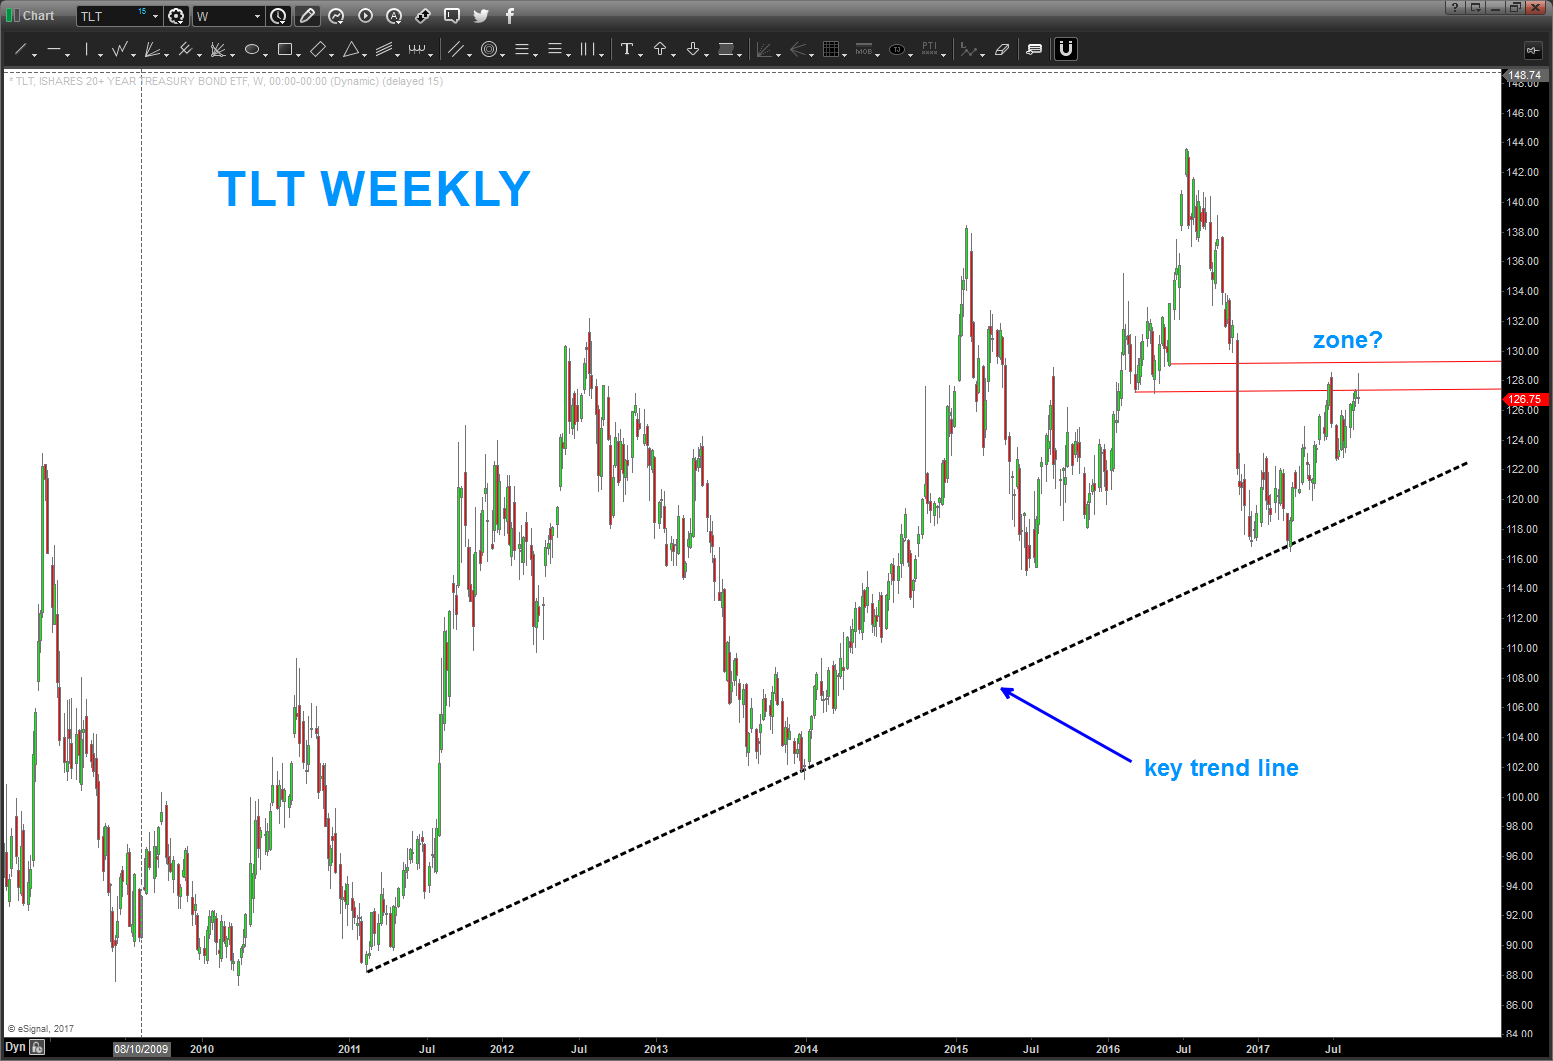
The TLT scraped bottom for a while, moving sideways for a few months before starting a multi-month relief rally. So what’s next?
Let’s look at the chart below. Of note, you’ll see a forecasted target zone that was based on a substantial gap down on the daily chart. TLT has rallied up to his area and should now be watched closely for signs of weakness.
I’ve also highlighted the ‘key’ trend line to monitor. IF we are still in a bullish environment THEN this trend line (black dashed) should hold any pullbacks.
20+ Year Treasury Bond ETF (TLT) Chart
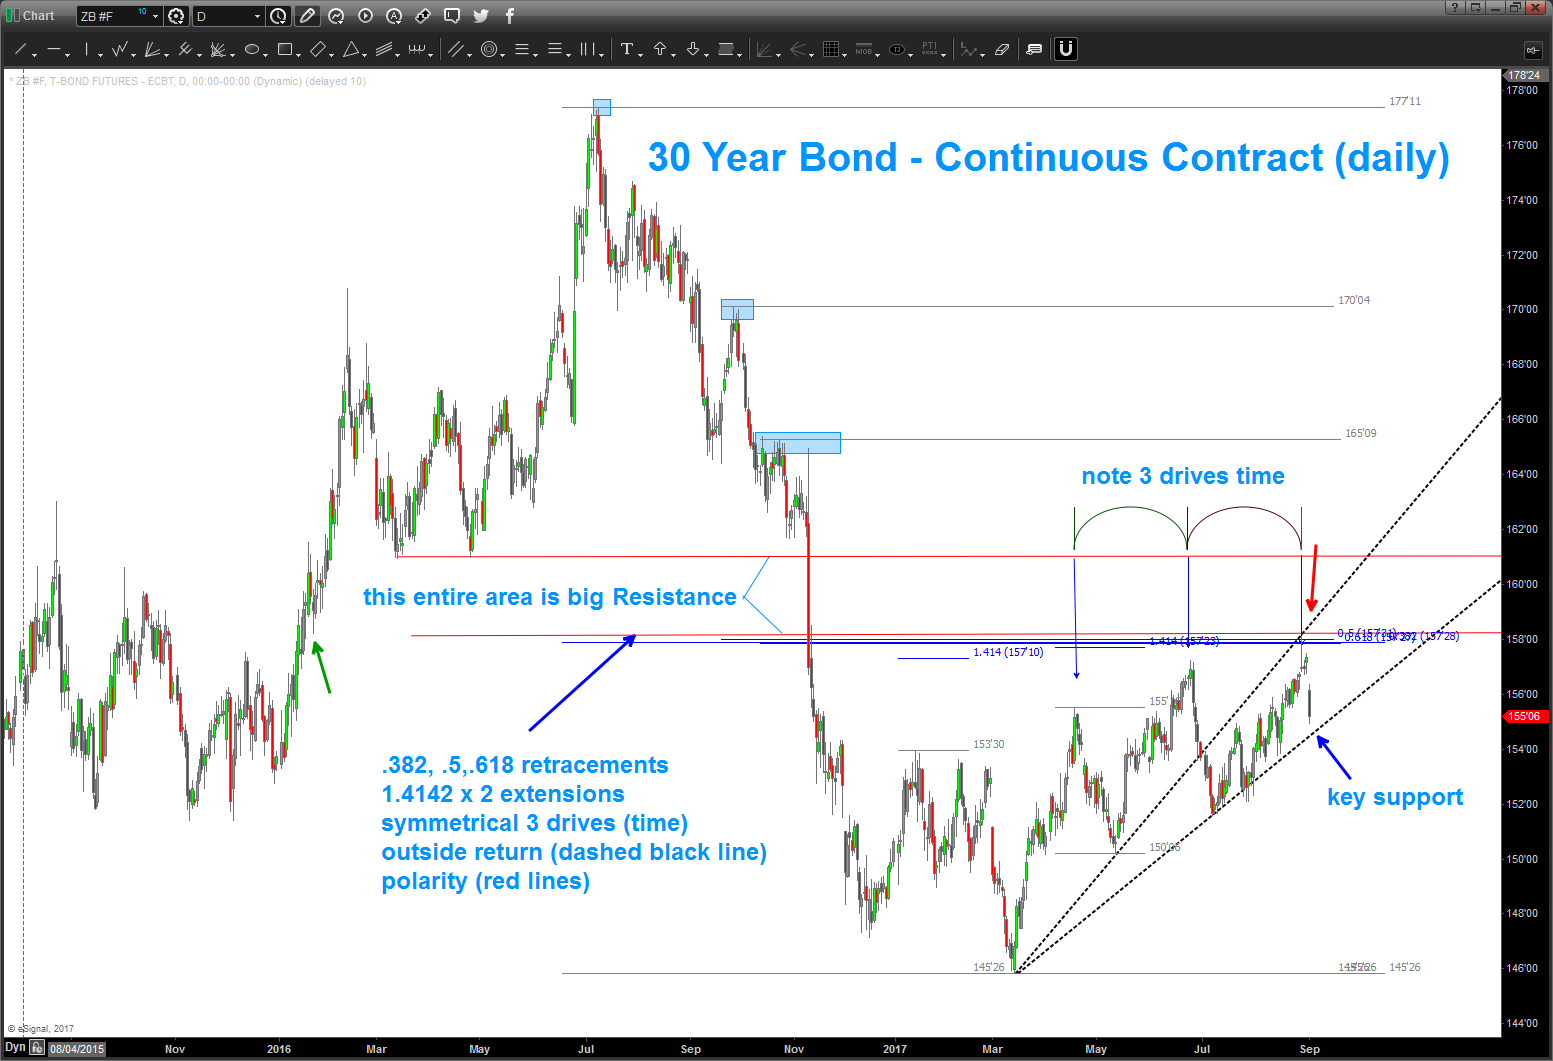
Additionally, the 30 year continuous contract bond has smacked into major resistance. Note the dashed black trend line labeled “key support” … keep an eye on this level for key support and to see if bonds will continue lower (rates higher).
30 Year Continuous Bond Chart
Thanks for reading and good luck out there.
Twitter: @BartsCharts
The author does not have a position in mentioned securities at the time of publication. Any opinions expressed herein are solely those of the author, and do not in any way represent the views or opinions of any other person or entity.
ALSO READ: Facebook’s Stock Price (FB) is Nearing a Short-Term Top?

: Showing Some Signs of Emerging Strength")
