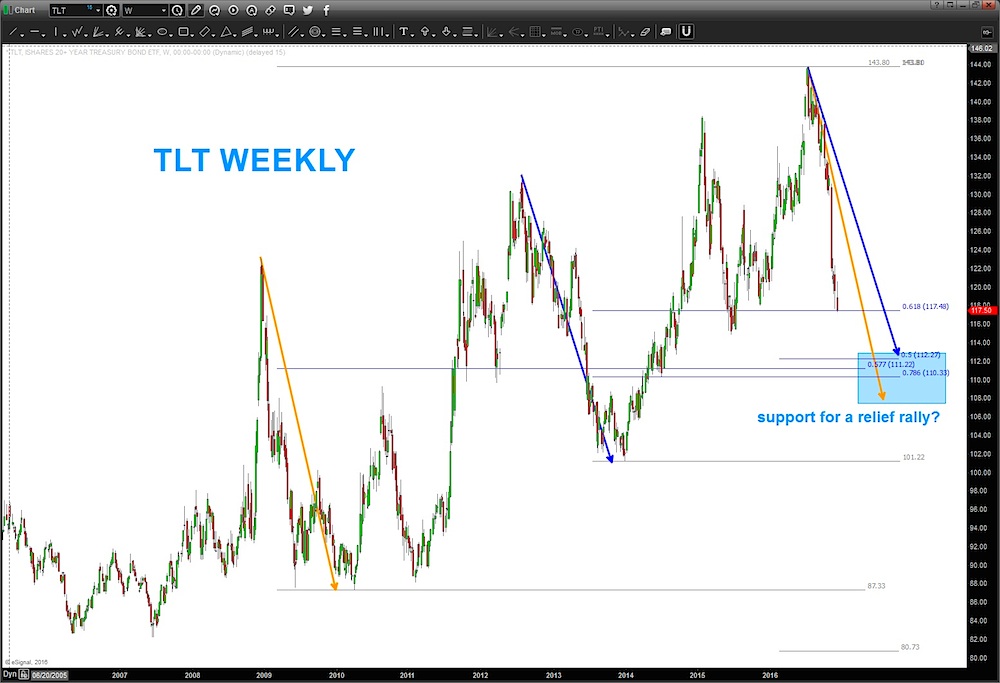
Back in July, I issued a warning about the Treasury Bonds market nearing a major high. Specifically, I focused on the 20+ Year Treasury Bonds ETF (NASDAQ:TLT).
Here’s an excerpt from that post (after showing 145 as a major price target):
I try not to pay attention to outside fundamental/news items and just look at the charts and the PATTERNS. Trade what you see, right? I see some very stretched and parabolic fixed income assets ready to produce a rising rate environment.
After trading up to 143.62, Treasury Bonds traded sideways for a couple months before turning lower. The initial decline targeted 132 as a potential bounce level for $TLT… and another opportunity to go short the Treasury Bonds (and $TLT) after the bounce. BUT that never materialized and it has been straight down since…
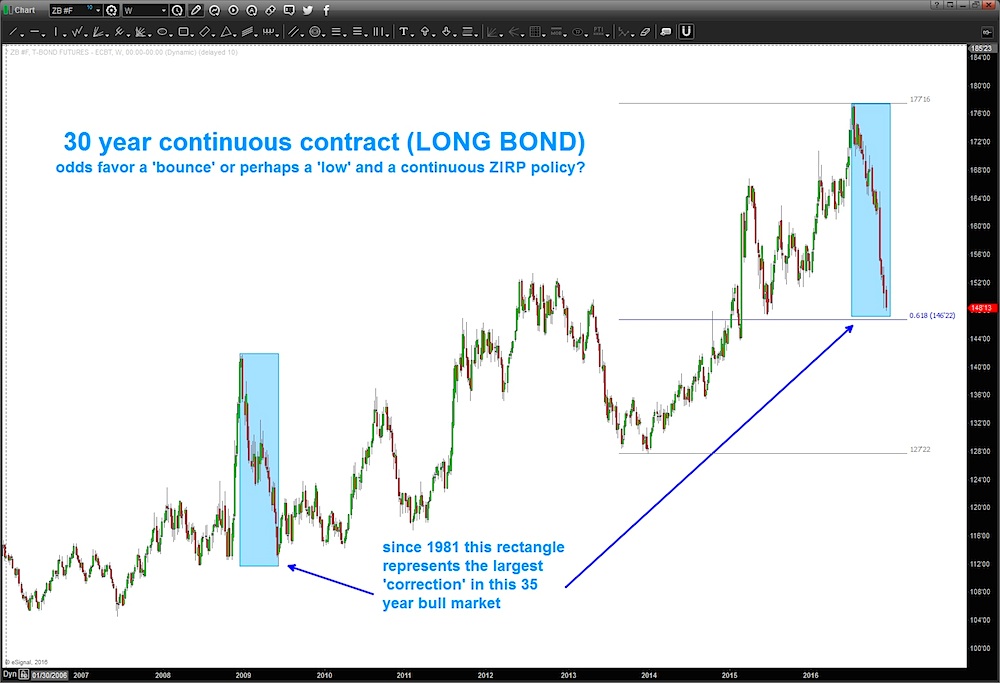
So where are we now? Because the TLT uses 20+ year treasury bond maturities, we can take a look at the “long bond” 30+ year Treasury Bond continuous contract as a potential roadmap – or at least another bond chart to use as confirmation, etc.
As you can see, in the long-term bull market in bonds, we have never corrected more than the blue rectangle. A little lower and a little more time we will have both the same price and time correction. The bond complex is deeply oversold, and it appears that a relief rally is in order.
Thanks for reading.
Twitter: @BartsCharts
Author does not have a position in mentioned securities at the time of publication. Any opinions expressed herein are solely those of the author, and do not in any way represent the views or opinions of any other person or entity.


