iShares Gold Trust (NYSEARCA:GLD) Analysis & Outlook:
Our steadfast bearishness toward the yellow metal, even as the world turned bullish, is paying off.
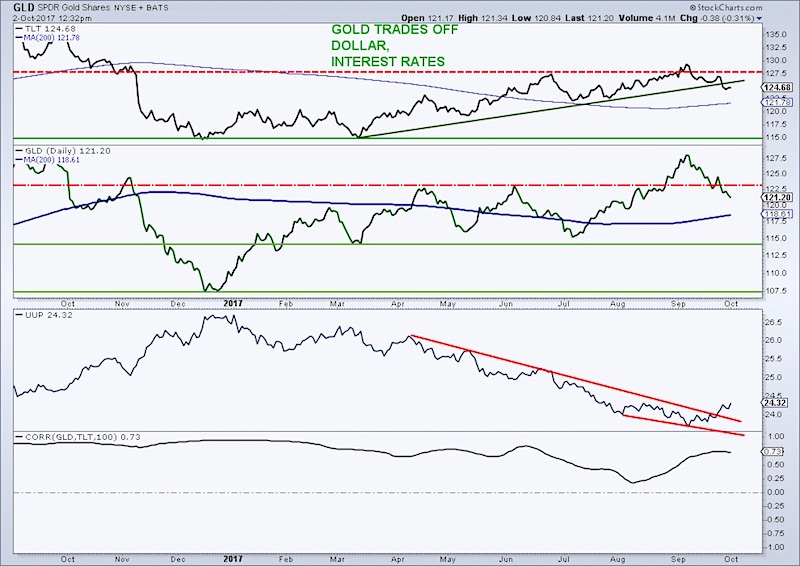
Gold prices (GLD) are sitting slightly below the key 123 level and I’d like to see additional weakness (2% below 123 – we’re almost there) to confirm the failed breakout and suggest a move back to the other end of the range in the 115 zone. Gold is oversold so a bounce isn’t out of the cards, but gold bulls need a big save here… and fast.
Note the coincident break lower in the 20+ Year Treasury Bond ETF (NASDAQ:TLT) as well as the break higher in the greenback, as forecast. The COT data has really taken a turn for the worse with commercial hedgers reducing their net futures positions by almost 200,000 contracts (as of 9/12) since the middle of July while large speculators amounted their largest gold futures position since the fall of 2016. Continue to be careful here!
Gold Prices vs Bonds vs U.S. Dollar Chart
Thanks for reading.
Feel free to reach out to me at arbetermark@gmail.com for inquiries about my newsletter “On The Mark”. Thanks for reading.
Twitter: @MarkArbeter
Any opinions expressed herein are solely those of the author, and do not in any way represent the views or opinions of any other person or entity.

: Showing Some Signs of Emerging Strength")
