A couple weeks ago, I wrote that I was looking for a bond market rally to short. Particularly on the iShares 20+ Year Treasury Bond ETF (NASDAQ:TLT).
Well, that treasury bond rally came. And an opportunity for savvy traders may be presenting itself.
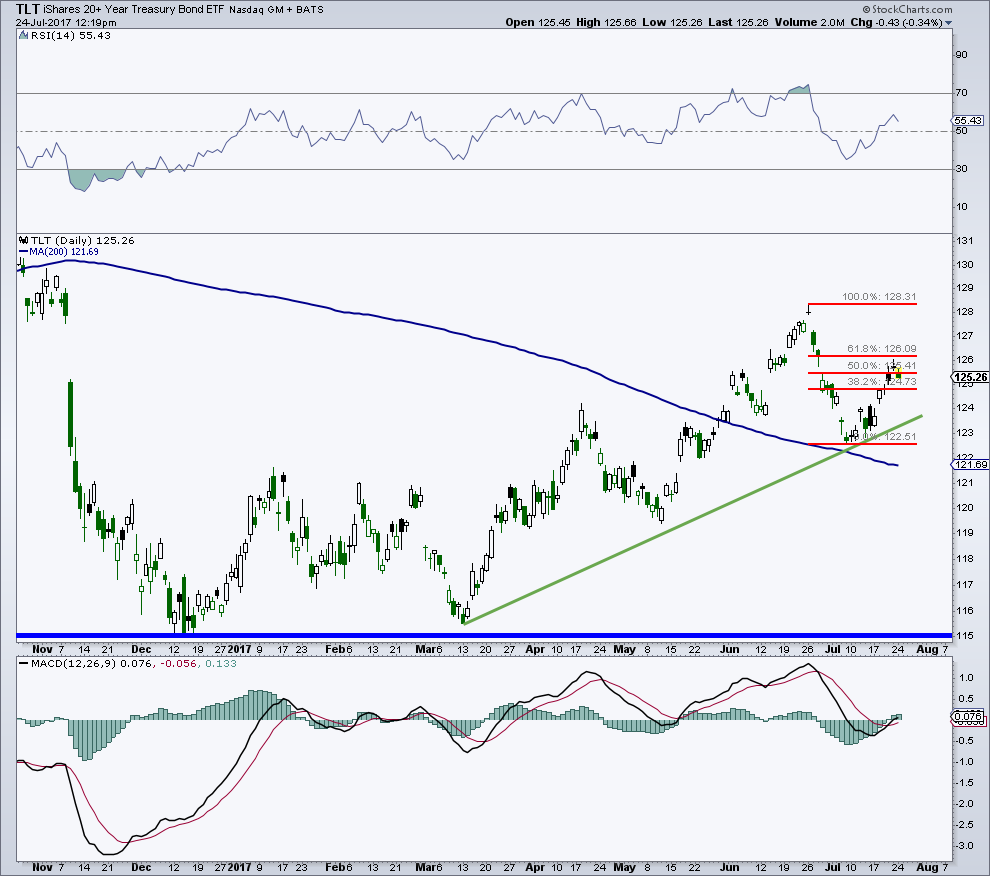
Looking at the chart below, you can see that the Treasury Bond ETF (TLT) has bounced and reclaimed about 50% of its recent losses. I am looking for bonds to fail on this rally, so I don’t see much upside from here.
On the downside, trendline and chart support sit in the 123/124 zone, with the declining 200-day average down at 121.76. Additional chart support comes in between 121 and 121.50 with a thick layer running from 121 all the way down to the December and March lows near 115.
On the upside, initial resistance sits in the 124.60 to 126 area with added chart resistance at the recent high near 128.
The COT data remains bearish for treasuries, while sentiment remains fairly bullish, not a good sign. I am waiting for a rally and topping action to short this market as I think the recent high was another peak for the long end.
Feel free to reach out to me at arbetermark@gmail.com for inquiries about my newsletter “On The Mark”. Thanks for reading.
Twitter: @MarkArbeter
Any opinions expressed herein are solely those of the author, and do not in any way represent the views or opinions of any other person or entity.


: Showing Some Signs of Emerging Strength")
