We often talk about leadership. Stocks that are leading the market higher. Sectors that are leading the market higher. Indices that are leading the market higher.
Why?
Because it pays to be invested in leadership when the market is on the way up. And one can avoid losses if they watch leadership when the market pauses or pulls back.
“The facts, Ma’am. Just the facts.” – Joe Friday
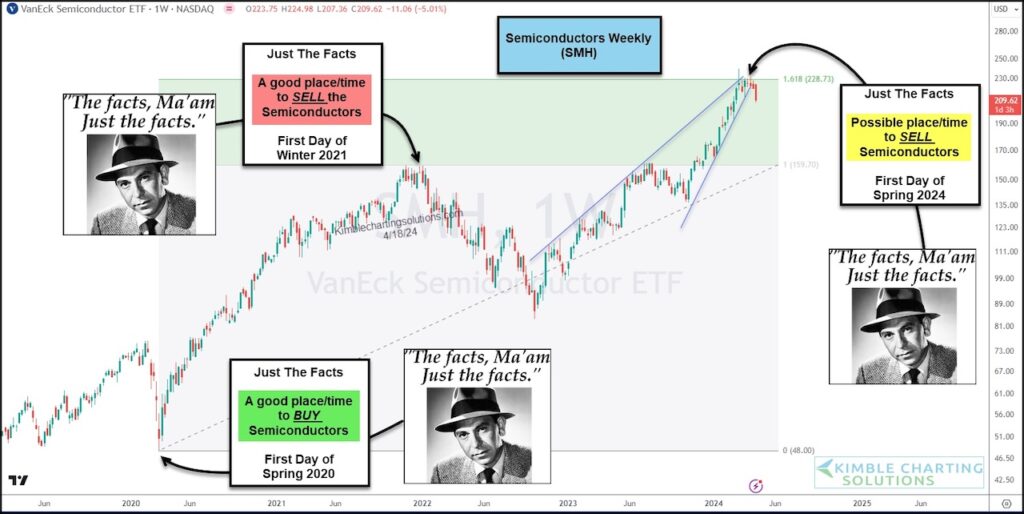
Today, we look at a “weekly” chart of another stock market leader: The Semiconductors Sector (SMH). And blend in some seasonality with the technical setup.
As you can see, the Semiconductors (SMH) bottomed the first day of Spring 2020 (good time to buy) and peaked the first day of winter 2021 (good time to sell). This year it looks like the first day of Spring may have been a good time to sell.
As you can see, the Semiconductors ETF (SMH) appears to be rolling over. But it’s also important to note that SMH may be rolling over from its 161% Fibonacci extension level.
Combined with the seasonal warning, this is a bad place for leadership to be rolling over! Stay tuned!!
Semiconductors Sector ETF “weekly” Chart
Note that KimbleCharting is offering a 2 week Free trial to See It Market readers. Just send me an email to services@kimblechartingsolutions.com for details to get set up.
Twitter: @KimbleCharting
The author may have a position in mentioned securities. Any opinions expressed herein are solely those of the author, and do not in any way represent the views or opinions of any other person or entity.
")


")
