The iShares 20+ Year Treasury Bond ETF (NASDAQ:TLT) is rallying off key lateral price support.
This bounce has neutralized the immediate bearish case… but it could still play into a bearish head and shoulders topping pattern. Time to take a closer look at the chart.
Bond Bulls:
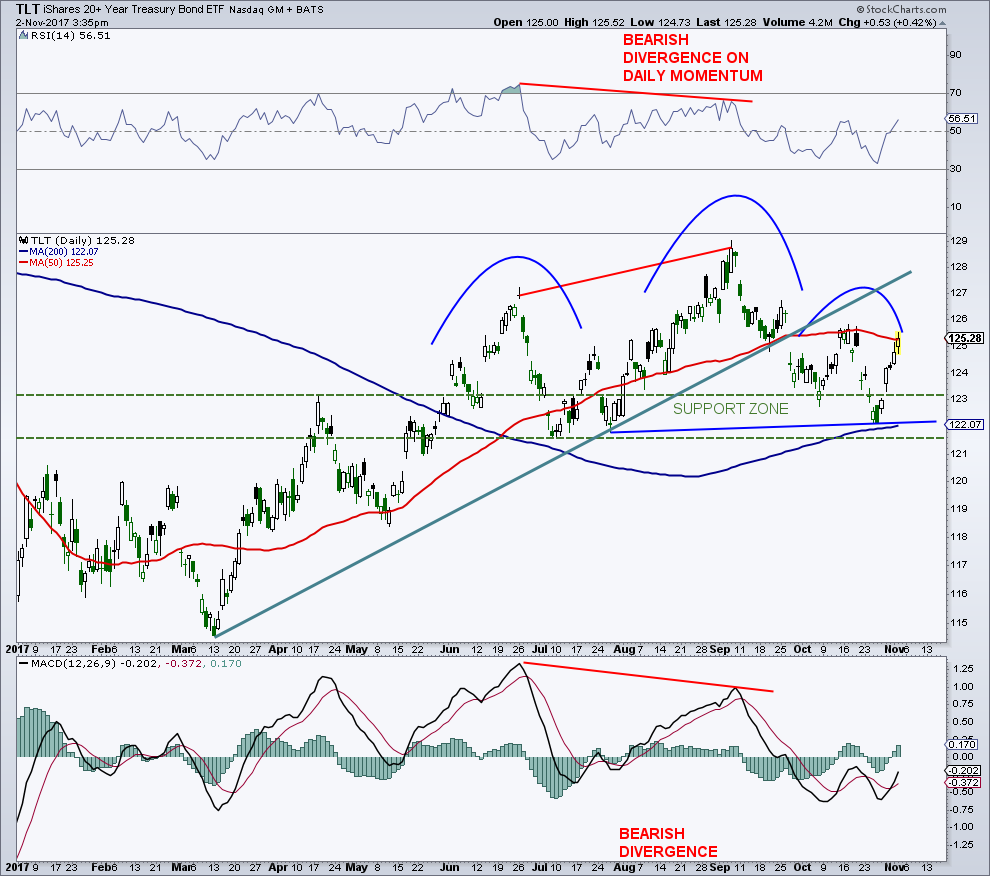
On the daily chart below, the treasury bond ETF tested a very important technical support zone near the 122 level. This level needs to hold… And so far, so good. TLT has rallied nearly 3 percent in the past week. It’s also worth noting that the RSI has snuck back above 50 and the MACD has crossed over and is nearing 0 (neutralizing the situation).
Bond Bears:
But TLT isn’t out of the “topping” pattern zone just yet.
Historically, treasuries trace out a lot of H&S’s, both tops and bottoms. A complex head and shoulders pattern could take shape from this area or even a bit higher. Something to be aware of.
COT data on the 10-year and 30-year has improved, but remains bearish, while sentiment remains somewhat bullish. I remain cautious on the long end of the curve.
20+ Year Treasury Bond ETF (TLT) Chart
Feel free to reach out to me at arbetermark@gmail.com for inquiries about my newsletter “On The Mark”. Thanks for reading.
Twitter: @MarkArbeter
The author may have positions in related securities at the time of publication. Any opinions expressed herein are solely those of the author, and do not in any way represent the views or opinions of any other person or entity.

 Rolling Over At Key Fibonacci Level?")


