Back in June, we took a look at a key inflation gauge and pointed out why the reflation theme wasn’t quite ready for primetime just yet.
The inflation gauge that I like to follow is a ratio of Treasury Inflation Protected Securities ETF (NYSEARCA:TIP) to the 20+ Year Treasury Bond ETF (NASDAQ:TLT). A quick reminder: when the TIP/TLT ratio is headed lower, inflation is of less concern… and when it is rising, it is of higher concern.
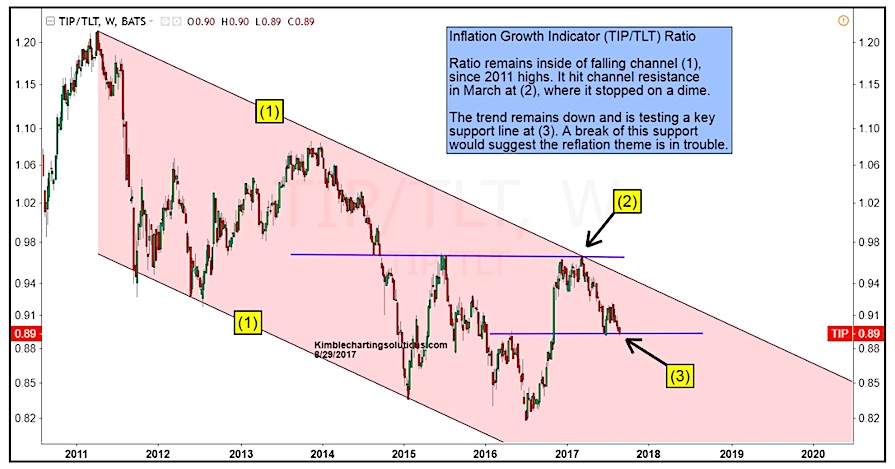
Back in June, the TIP/TLT ratio began to reverse lower after testing dual resistance – horizontal & channel lines. You can still see this in the updated chart below at point 2. This was a sign that the “reflation” trade needed more time to develop.
So what is the inflation indicator telling investors now?
The ratio remains inside of its falling channel and the trend remains down. The TIP/TLT ration is now testing a key near-term support line at point 3 (in the chart below). A break of this support would suggest the reflation theme is in trouble.
So for investors wondering about the prospects for economic growth and interest rate hikes by the Federal Reserve… keep an eye on this gauge!
TIP / TLT Inflation Gauge
Thanks for reading.
Twitter: @KimbleCharting
Any opinions expressed herein are solely those of the author, and do not in any way represent the views or opinions of any other person or entity.

: Showing Some Signs of Emerging Strength")


: Showing Some Signs of Emerging Strength")
