In this week’s investing research outlook, we analyze the technical setup and trends of the S&P 500 Index (INDEXSP:.INX), check in on investor sentiment and market breadth indicators, and discuss emerging themes and news that we are watching closely in our investing research.
Here’s a summary of our findings for the week ending August 25, 2017:
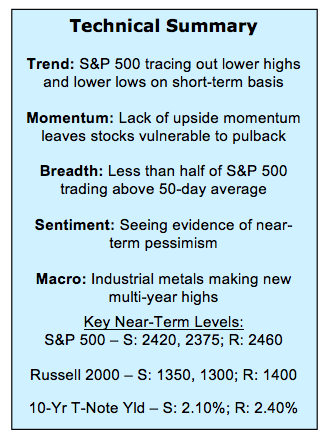
Short-Term Trends Take a Breather – The long-term up-trend in the S&P 500 (NYSEARCA:SPY) remains intact, but shorter-term price trends have stalled and the intra-day chart of the index suggests the emergence of lower highs and lower lows.
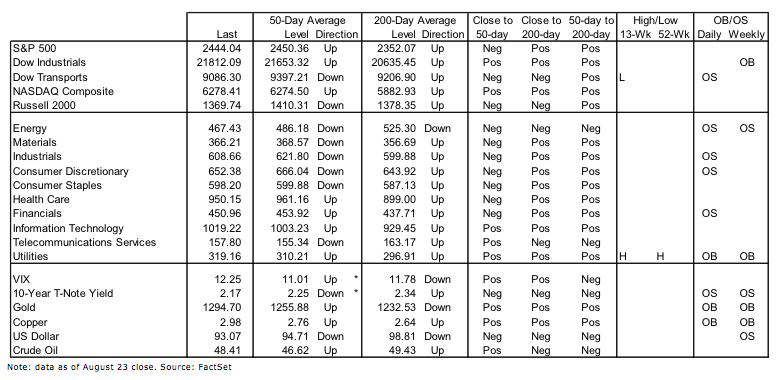
Breadth Indicators Continue to Slip – A majority of industry groups remains in up-trends, but broad market conditions continue to deteriorate. The new low list has expanded and the Value Line Geometric Average index has moved from all-time high to flat for the year in the space of just a few weeks.
Copper and Bonds Arguing Over Economic Outlook – The 10-year Treasury Note Yield (INDEXCBOE:TNX) has slipped below 2.20% and is approaching its lowest level of 2017, while Copper (and other industrial metals with it) is breaking out to new multi-year highs. The tension between copper and bonds suggests disagreement over the health of macro backdrop.
Stock Market Indicators
S&P 500 Index
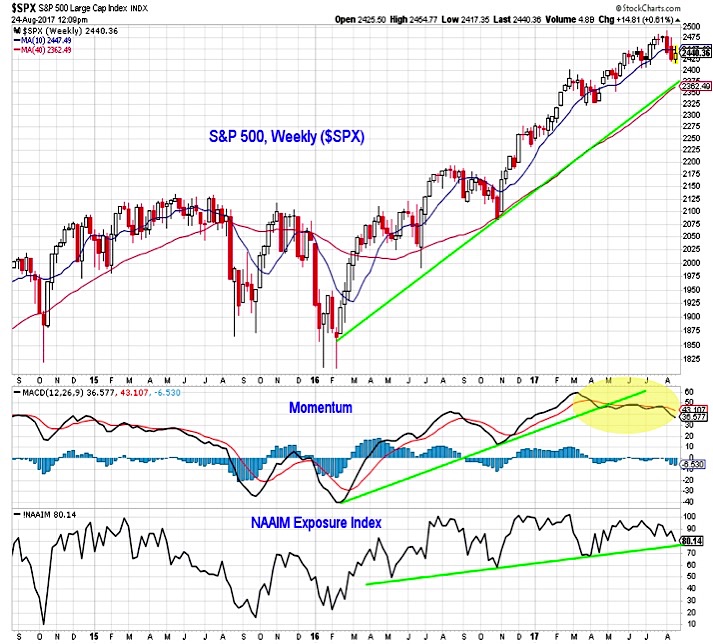
The cyclical up-trend that emerged off of the early February lows remains intact for the S&P 500. Momentum, however, continues to trend lower and after having reached an extreme, the NAAIM exposure index is starting to drift lower. After evidence of extreme optimism, investors shifting away from equities is a headwind for stocks. Longer-term support for the S&P 500 first builds in the 2350-2375 range.
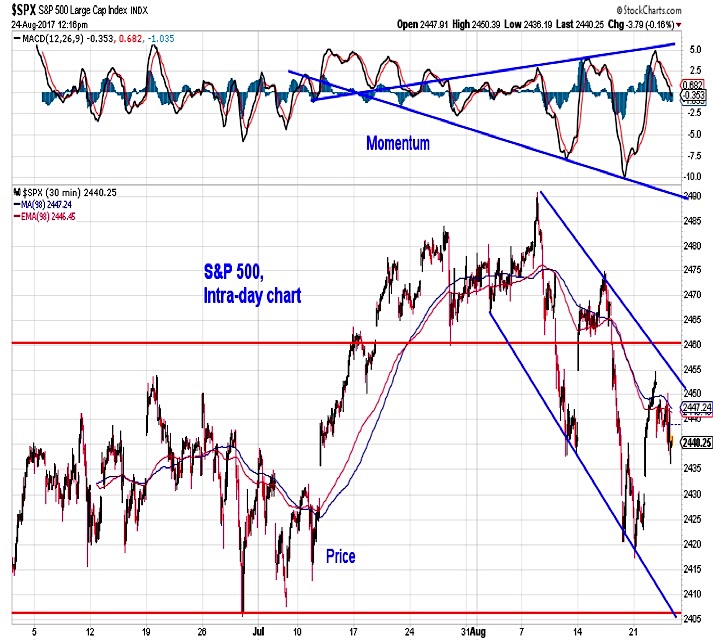
While the long-term up-trend is intact, a shorter-term down-trend has emerged. The S&P 500 has been making lower highs and lower lows since peaking in early August. A break below 2420 would continue this pattern, while a move above 2460 would suggest it has run its course.
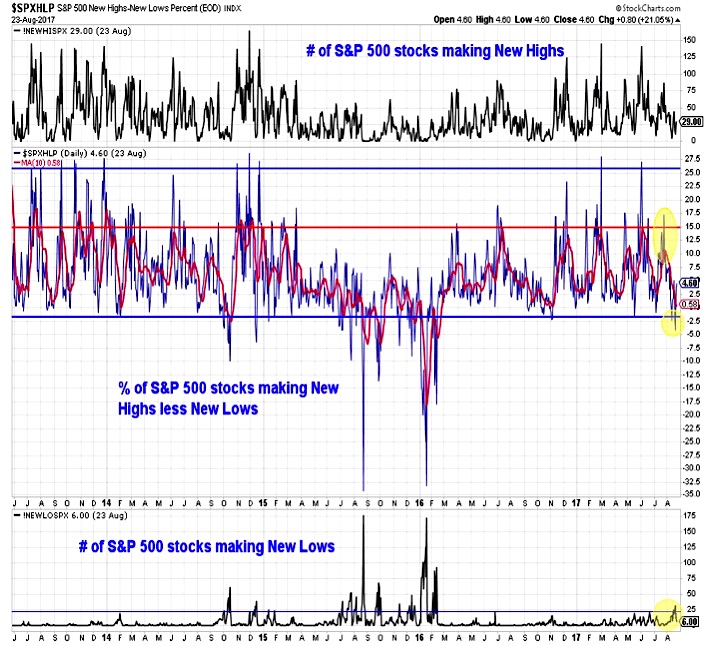
Another breadth warning has been the modest expansion in the new low list. The number of stocks making new lows has moved to its highest level since early 2016, although it does remain relatively minimal. Perhaps of more concern was the failure of the new high list to expand in July as the indexes were making new highs.
The foregoing notwithstanding, the longer-term breadth backdrop remains supportive even though we have seen a significant deterioration in the percentage of industry groups in up-trends.
continue reading this article on NEXT PAGE…


