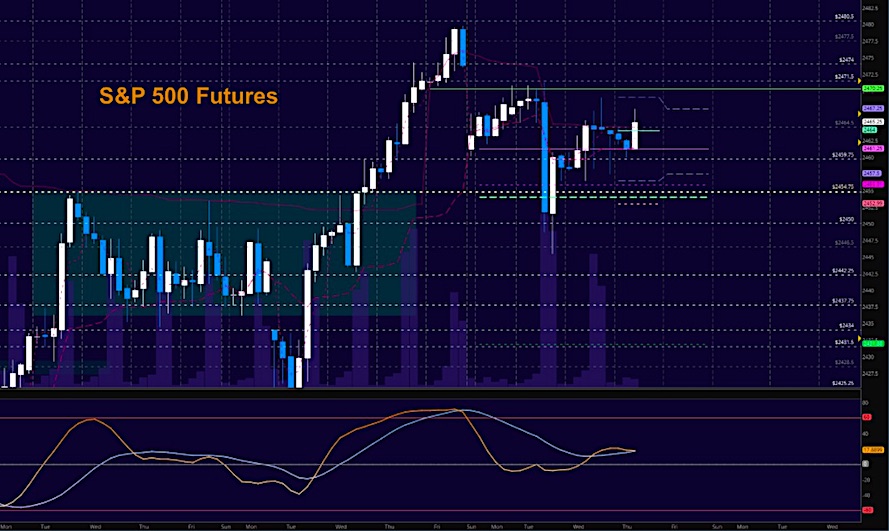
S&P 500 Futures Trading Outlook For September 7
Stock Market Considerations For September 7, 2017
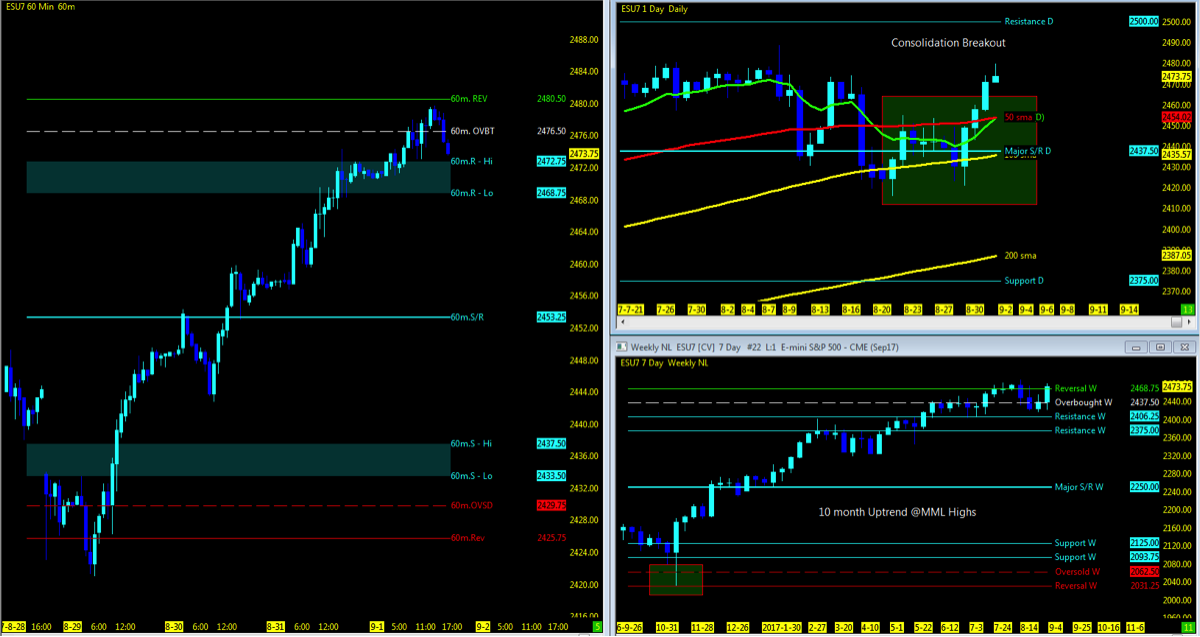
The S&P 500 (INDEXSP:.INX) continues to float higher but is subject to strong layered overhead resistance. What happens...
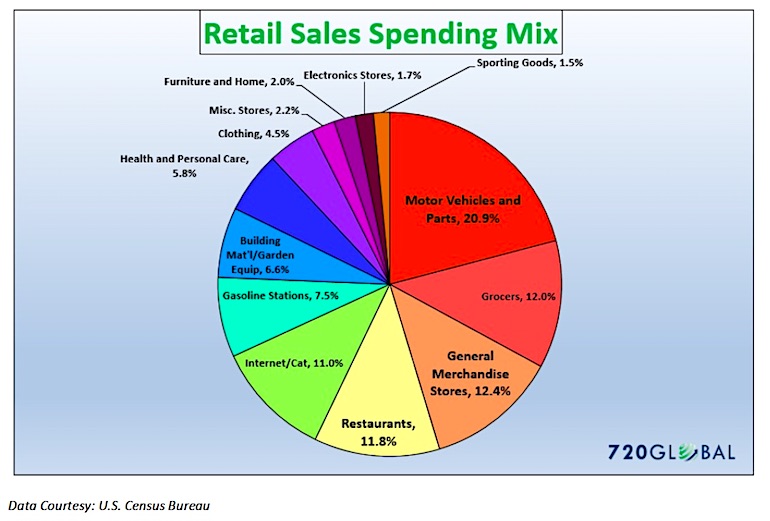
Are U.S. Consumers Getting Exhausted… By Debt?
Consumption Exhaustion
When people use the word catalyst to describe an event that may prick the stock market bubble, they usually discuss something singular, unexpected...
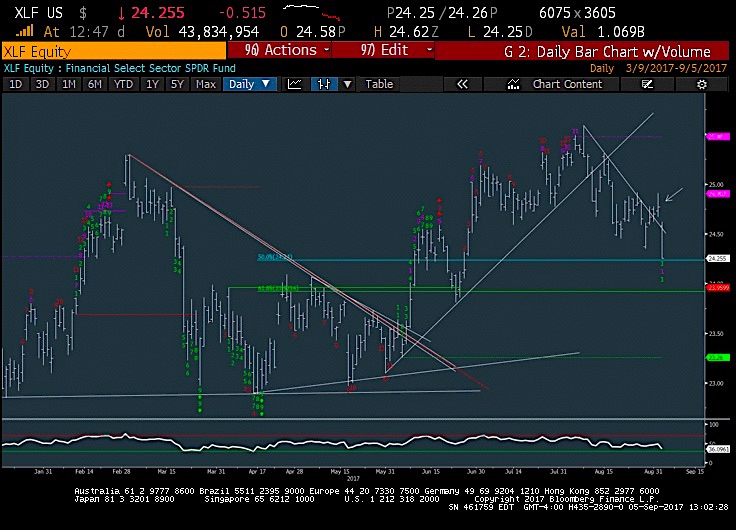
S&P 500 Trading Update: Tech And Financials Weigh On Bulls
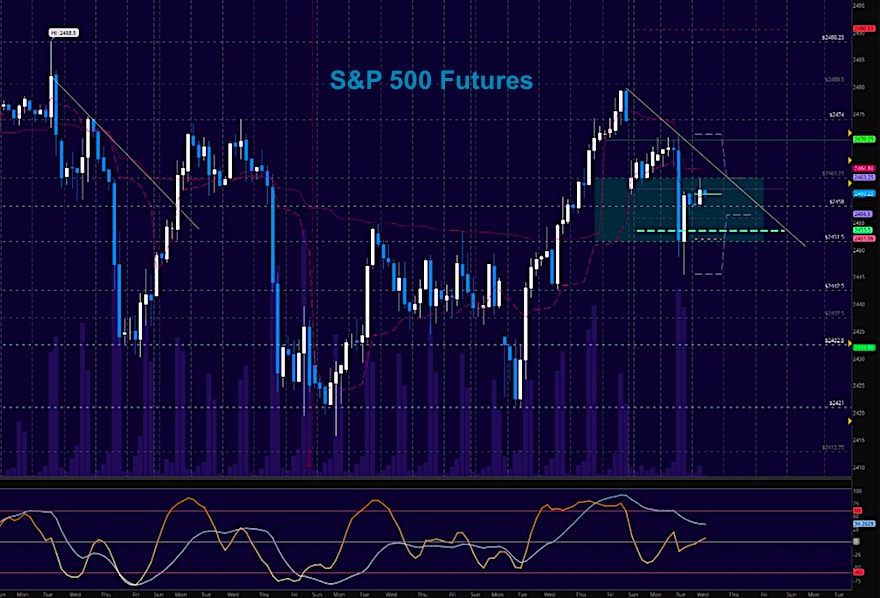
S&P 500 Trading Outlook (2-3 Days)- BEARISH
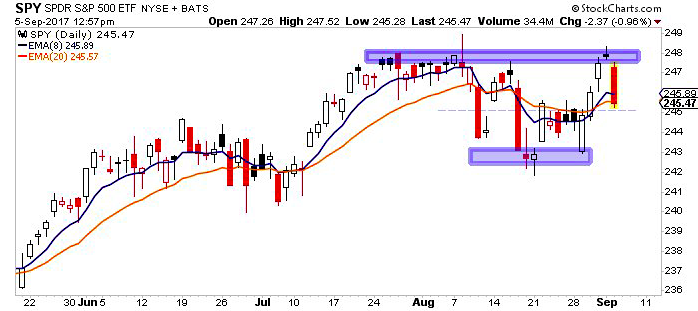
Tuesday's selloff was bearish for the S&P 500 (NYSEARCA:SPY) in undercutting near-term support, but it managed to hold 2455 by...
Stock Market Futures Trading Outlook for September 6
Stock Market Futures Trading Considerions For September 6, 2017
The S&P 500 (INDEXSP:.INX) is attempting to rally after yesterday’s deep selloff. Traders will need to...
S&P 500 Update (SPY): Bears Strike Back
Sellers have first movers advantage out of the gate in post Labor Day trading, which typically represents a period where the majority of market...
Natural Gas Prices Coil As Bullish Seasonality Approaches
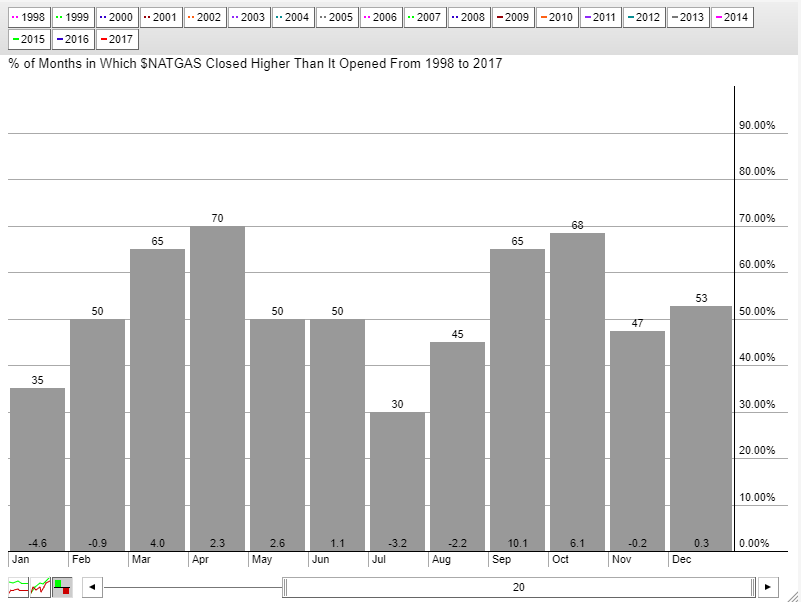
Natural Gas (NG) continues to trade in a range-bound manner in 2017. The prompt-month contract peaked on the final trading day of the year...
Treasury Bonds Rally Nears Key Price Resistance Area
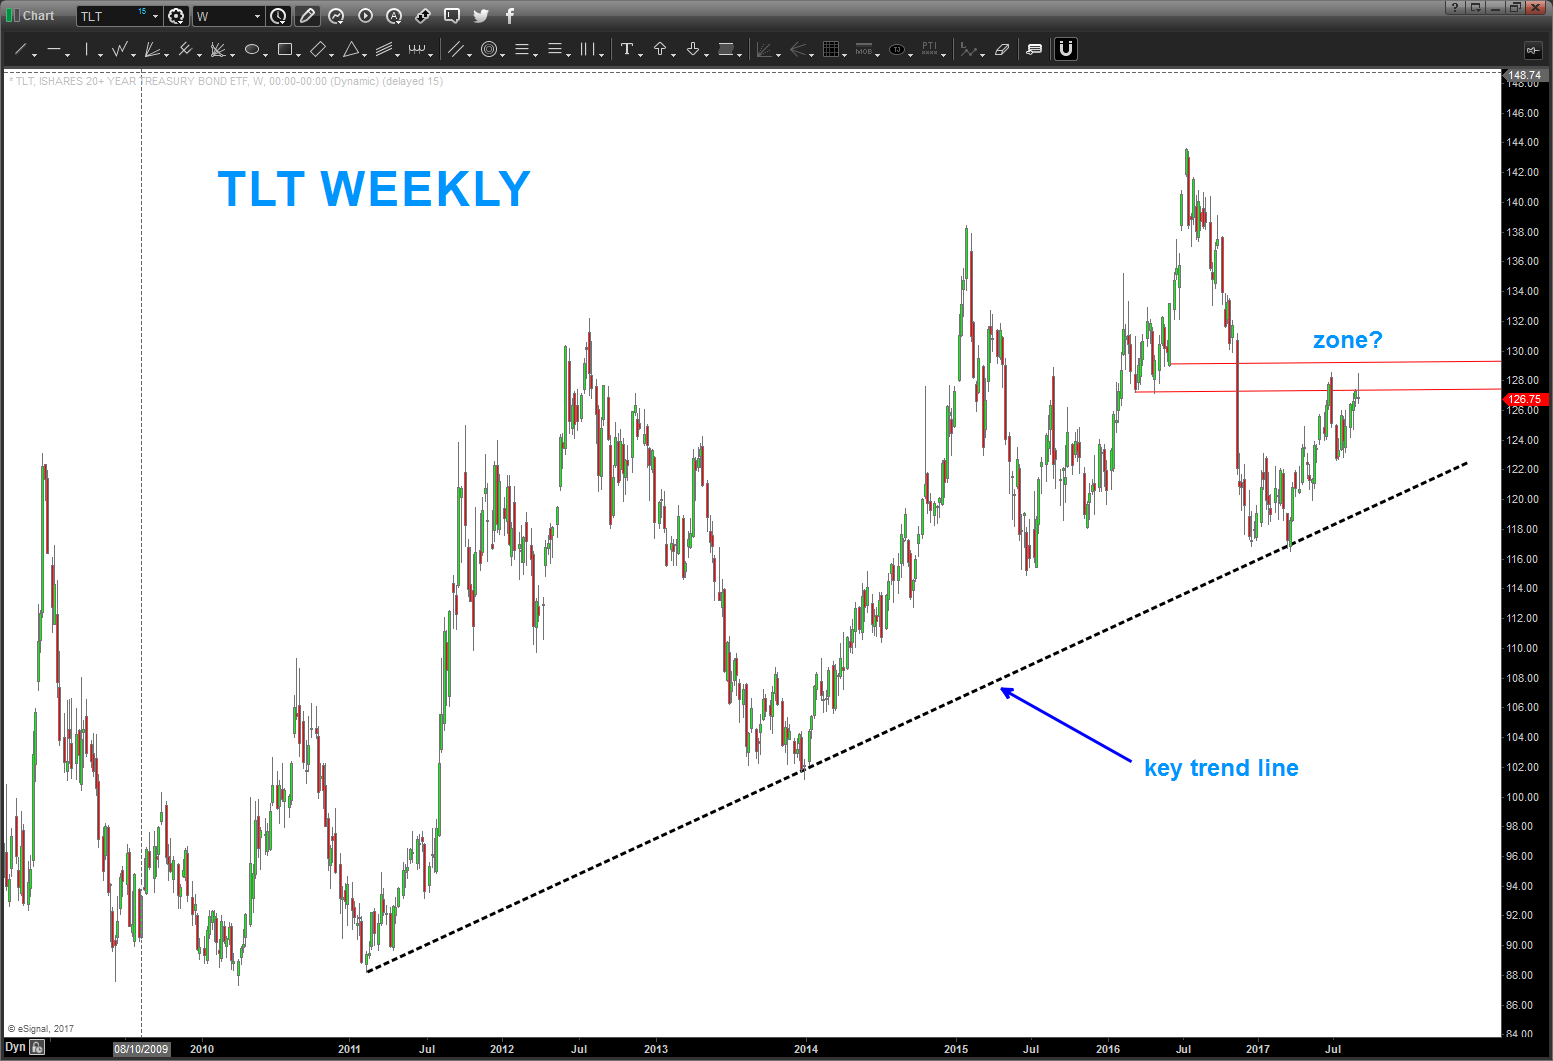
In my last update on the 20+ Year Treasury Bond ETF (NASDAQ:TLT) and broader bond market, I highlighted the case for a deeply oversold...
Stock Market Trends Weekly Update: Uptrend Intact
THE BIG PICTURE
The broader stock market remains in an uptrend, while geopolitical risks continue to linger. The best thing to do is follow the...
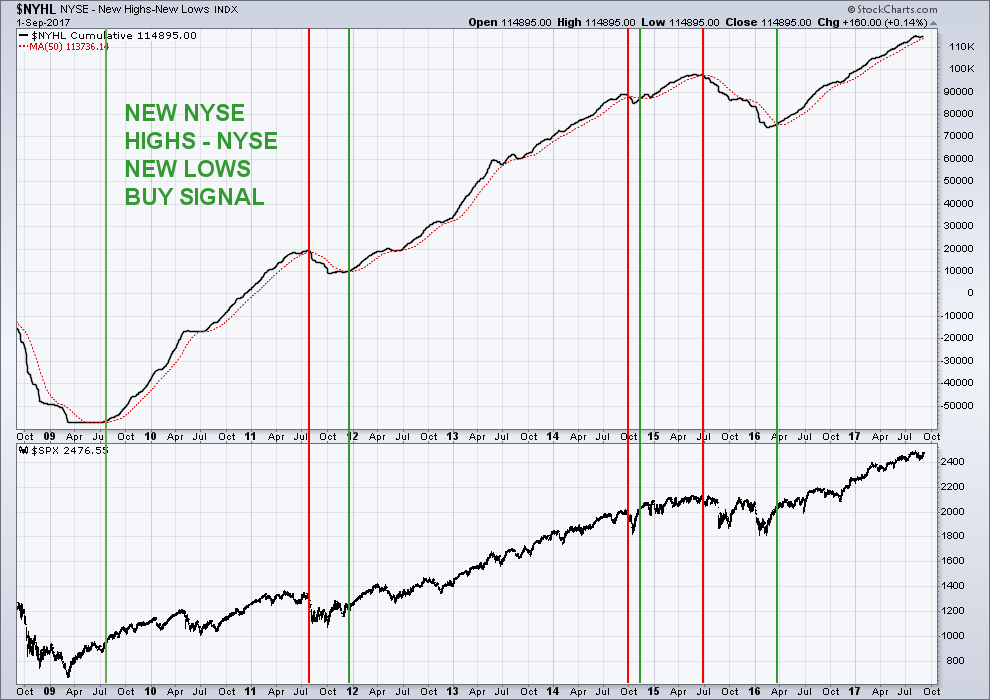
S&P 500 Outlook Into September: Breadth Remains A Pillar
While some investors, and at least a handful of market analysts, obsess about a multitude of negatives or potential negatives, the average stock continues...
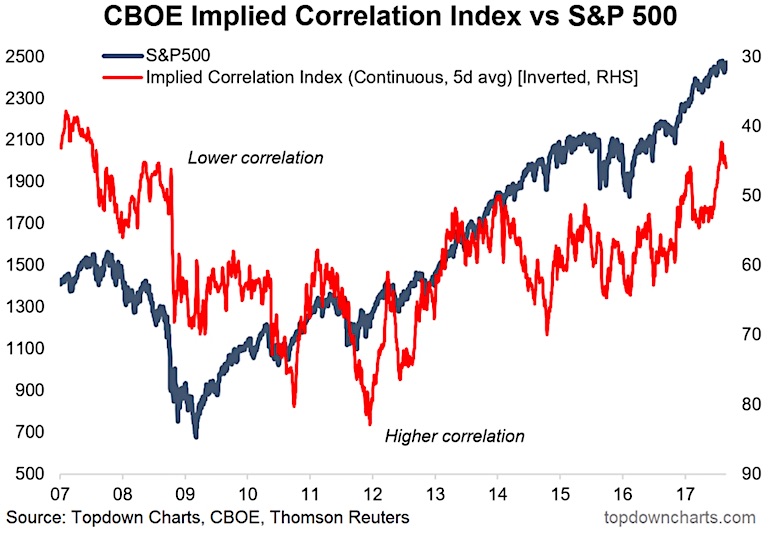
CBOE Implied Correlation Index Highlights Rising Risks For Investors
In this article we take another look at a somewhat obscure indicator "implied correlations".
The Implied Correlation Index comes from the CBOE and is a...

