While some investors, and at least a handful of market analysts, obsess about a multitude of negatives or potential negatives, the average stock continues to march to its own bullish drum. In today’s S&P 500 (INDEXSP:.INX) market outlook, I take an extensive look at breadth and its importance for an extension of the bull market.
As I have said, there are two things that make up the lifeblood of a bull market: market rotation and market breadth. In some ways, they are one and the same. Quite simply, as long as money rotates from one group to another, and stays in the market, major corrections and bear markets just do not occur. So rotation gives us at least neutral breadth in essence.
As new money flows into ever-rising prices, and certainly on any dips, this tilts the market breadth statistics to the positive side of the ledger. The act of holding on to one’s stock also aids this process as it reduces the supply of stock available to the public, aiding in ever-higher prices.
I see some making the comparison that today’s stock market looks like 2015 and that we are headed for big time trouble. I have pointed out at least once in the past that the breadth makeup is far different today than it was back in 2015.
This, in my opinion, (ex. any exogenous events) prohibits any kind of large dump by stocks.
Looking at the common stock only advance-decline line from back in 2015, the a/d line peaked in April. The S&P 500 (NYSEARCA:SPY) did peak in May, only about a month later, but the index virtually hit the same levels in July as it did in May. In addition, the “500” didn’t really gather downside steam until mid-August.
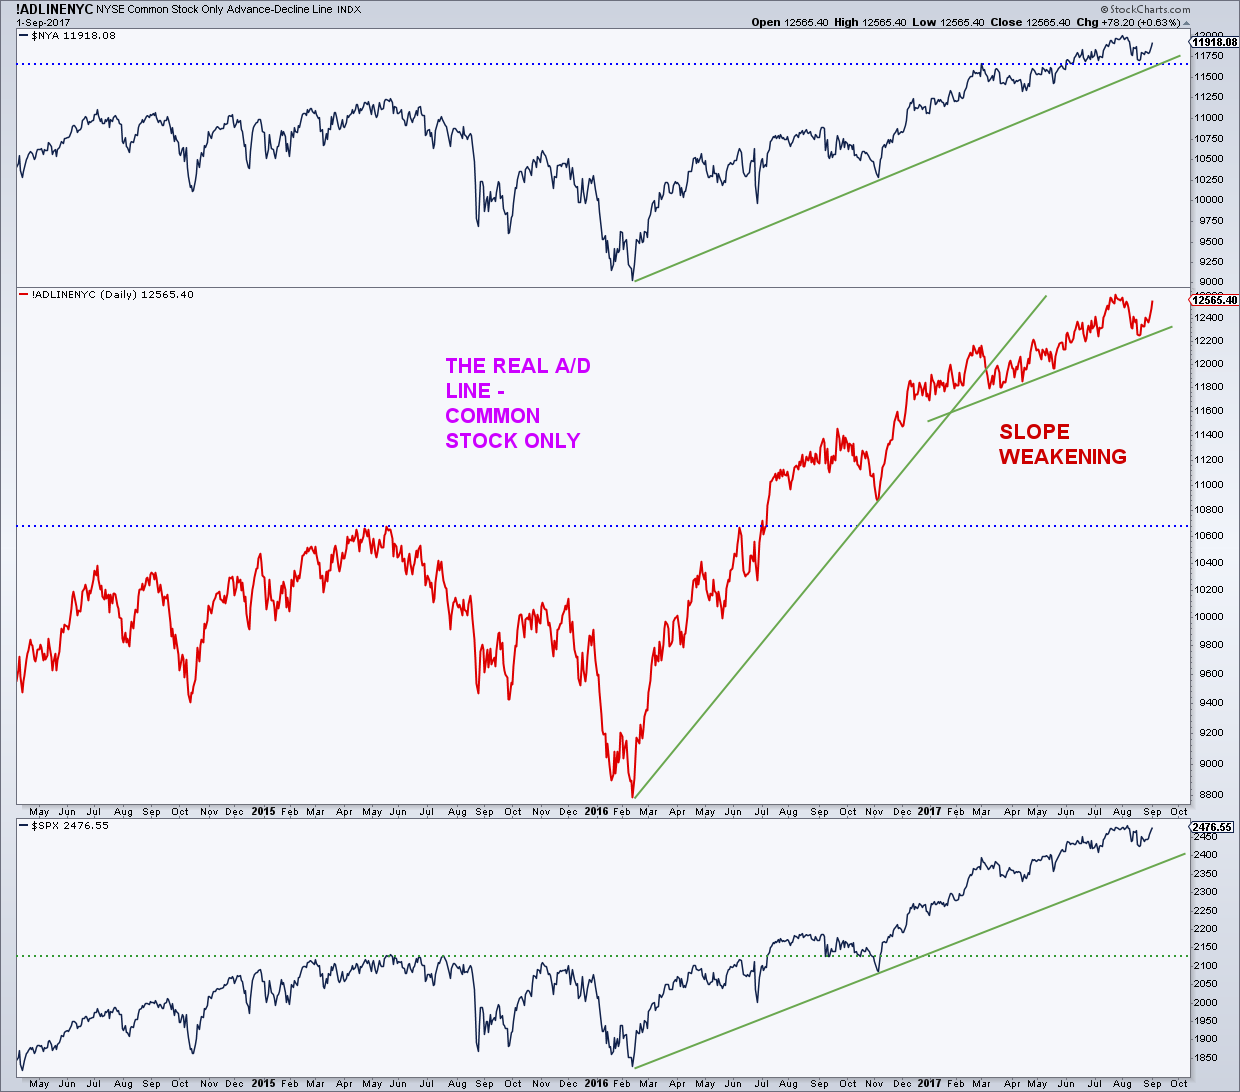
Today the a/d line is just off a fresh all-time-high on July 24.
Another big difference between now and 2015 is the condition of the average stock in the NYSE Composite. Back in July and August 2015, the average stock on the NYSE was below its 50-day and 200-day average. In fact, only 25% to 40% of the stocks on the NYSE were above their 50- and 200-day averages, and this was before the market rolled over. Today, the range of stocks above their 50-day and 200-day sits between 50% and 58%, which is much stronger than in 2015.
Another favorable comparison to 2015 as well as other major tops is a very simple advance decline line of new 52-week highs on the NYSE vs. new 52-week lows on the NYSE. We plot the cumulative difference on a daily chart and overlay its 50-day moving average. When the a/d line crosses above the 50-day, a buy signal is given and when the a/d line crosses under, a sell is given.
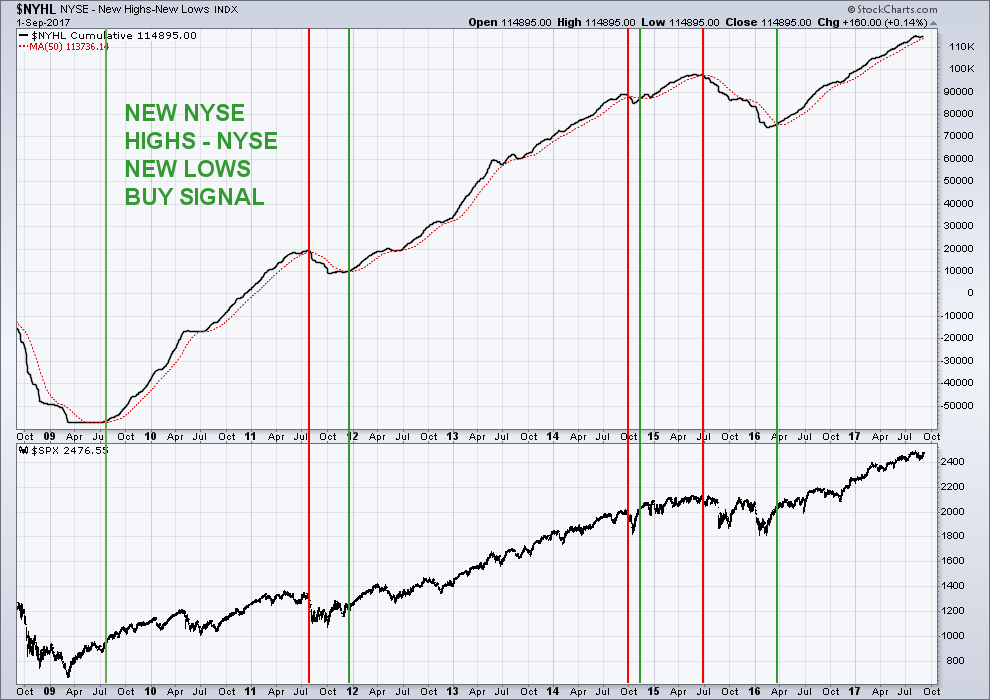
Historically, the sell signals have better timed (that is getting you out closer to the top) than the buy signals (getting you in near the bottom).
The last signal was a buy back in March 2016. The previous sell signal was early July 2015, well before the equity market rolled over. Despite all the talk about the increase in the number of new lows of late and the decrease in the number of new highs, the indicator is still on a buy signal. I will repeat something about the increase in the number of new 52-week lows since February: The big spikes in new 52-week lows occurred in the months March, June, and August.
One only has to look at the Energy Sector (XLE) for clues about new lows. In each one of these months, the energy sector was making another new low.
Looking at the makeup of new lows during some of these time periods, it was littered with energy names. Some days, over 50% of the new lows came from the energy sector. Energy represents a small percentage of the S&P 500 and its movements are not very important for the overall market. Certainly, if crude oil crashed again, it could have some negative ramifications, but it is also a tax cut for individuals and corporations alike.
Breadth is not perfect, and there has been some deterioration under the surface, but not enough to raise the yellow flag. The percent of NYSE stocks above their 50-day last peaked in November 2016 at 83%. There was a peak in July up at 75%, with a current reading of 50%. These are clear bearish divergences as the NYSE has made higher highs since November, however, the advance since early March has been very labored. NYSE advancing volume minus declining volume has stalled since March along with price. This measure should mirror price and when it does not, something’s amiss. The a/d line of volume as it’s sometimes referred to rolled over sharply in May 2015, giving a nice warning that problems lay ahead. We also saw nice market warnings in 2007/08 and in 2011 from the volume breadth indicator.
The S&P 500 has broken its short-term downtrend despite the swirling negative news flow. I’m not sure if the current pullback is over as so far we’ve had one 3 wave or ABC decline and one 3 wave or ABC advance. If the pullback is not over, the market should probably roll over soon. On the downside, the “500” got as low as 2,417 on August 21, slightly above my second layering area of the 2,400 region. I would much prefer at least a little more downside as it creates more opportunity for upside. What I want and what I get many times, however, do not line up.
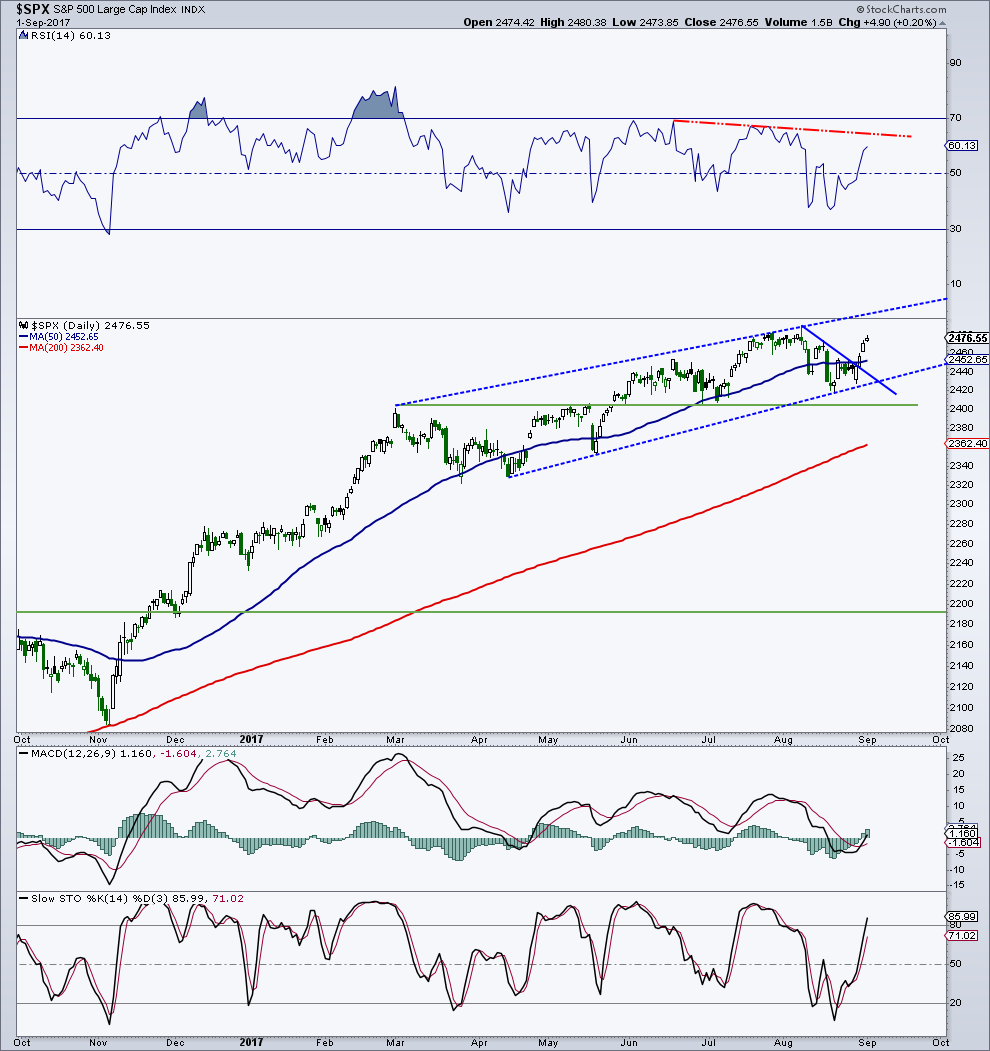
Below 2,400 would open the door for a test of the rising 200-day average near 2,361. There is a decent amount of chart support in the 2,320/2,330 area as well. At this point, this would be a worse case scenario and therefore, I recommend layering in or increasing equity exposure at each support level I have mentioned.
Conclusion: In the near term, I remain a little cautious on the stock market, but I still see 2,500+ sometime later this year for the S&P 500. I would layer into equities at the support zones (2,400/2,410, 2,320/2,340) I have outlined.
Feel free to reach out to me at arbetermark@gmail.com for inquiries about my newsletter “On The Mark”. Thanks for reading.
Twitter: @MarkArbeter
The author may have positions in related securities at the time of publication. Any opinions expressed herein are solely those of the author, and do not in any way represent the views or opinions of any other person or entity.


