Stock Market Futures Trading Considerions For September 6, 2017
The S&P 500 (INDEXSP:.INX) is attempting to rally after yesterday’s deep selloff. Traders will need to watch how the price action deals with overhead resistance to gauge the strength of this bounce.
Check out today’s economic calendar with a full rundown of releases. And note that the charts below are from our premium service and shared exclusively with See It Market readers.
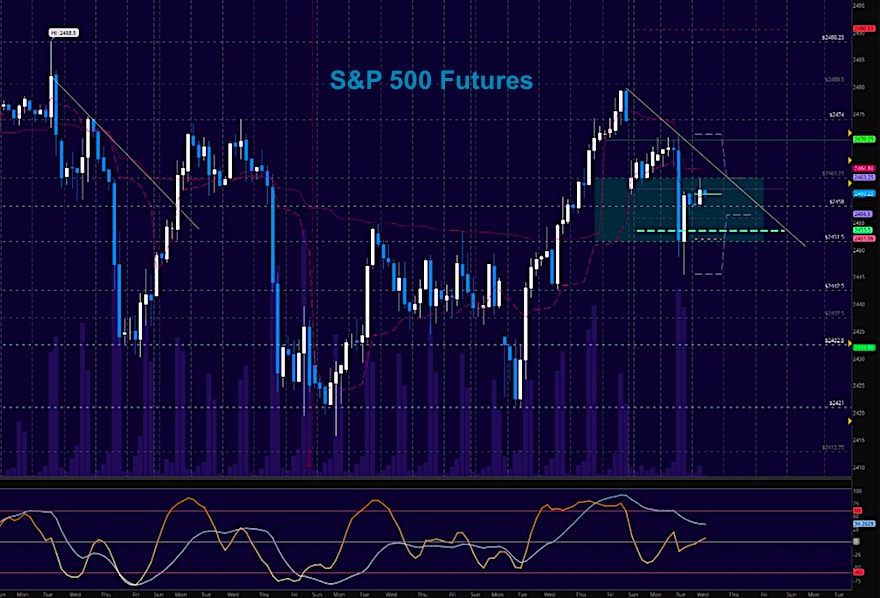
S&P 500 Futures (ES)
Wide range bound pattern continues as September gets underway with the beginning of earnings reports. Support action holds at 2448 to 2451.5. Resistance action holds near 2463.5 today. The bullets below represent the likely shift of trading momentum at the positive or failed retests at the levels noted.
- Buying pressure intradaywill likely strengthen above a positive retest of 2463.5
- Sellingpressure intraday will likely strengthen with a failed retest of 2451.5
- Resistance sits near 2463.5 to 2465.5, with 2468.5 and 2474.5 above that.
- Support holds between 2451.5 and 2445.5, with 2439.5 and 2431.5 below that.
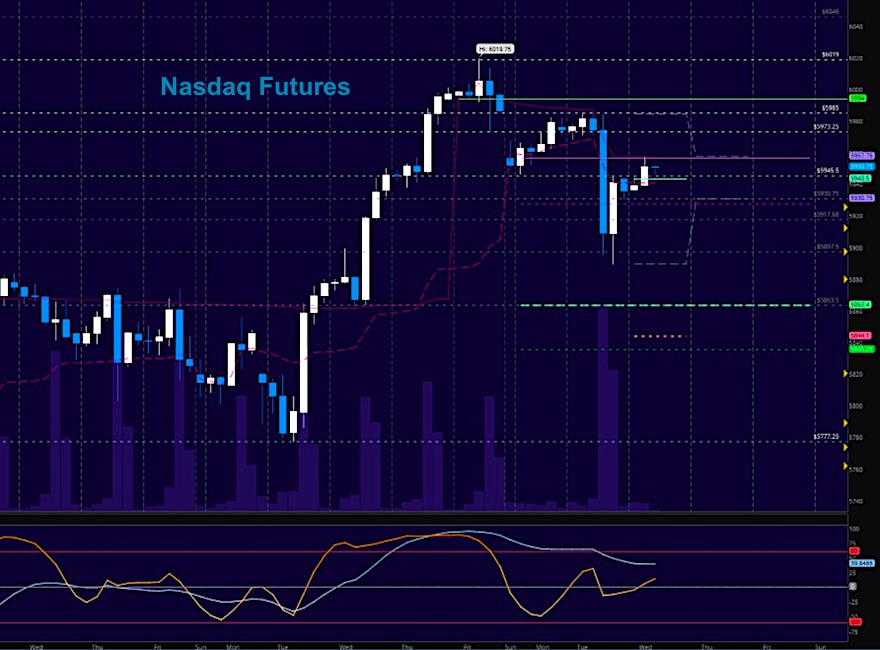
NASDAQ Futures (NQ)
MIXED BAG – Broadening downside wedge. The bullets below represent the likely shift of intraday trading momentum at the positive or failed tests at the levels noted:
- Buyingpressure intraday will likely strengthen with a positive retest of 5964
- Sellingpressure intraday will likely strengthen with a failed retest of 5930
- Resistance sits near 5962.75 to 5968.25, with 5973.25 and 5985.5 above that.
- Support holds between 5930.25 and 5917.5, with 5906.5 and 5891.5 below that.
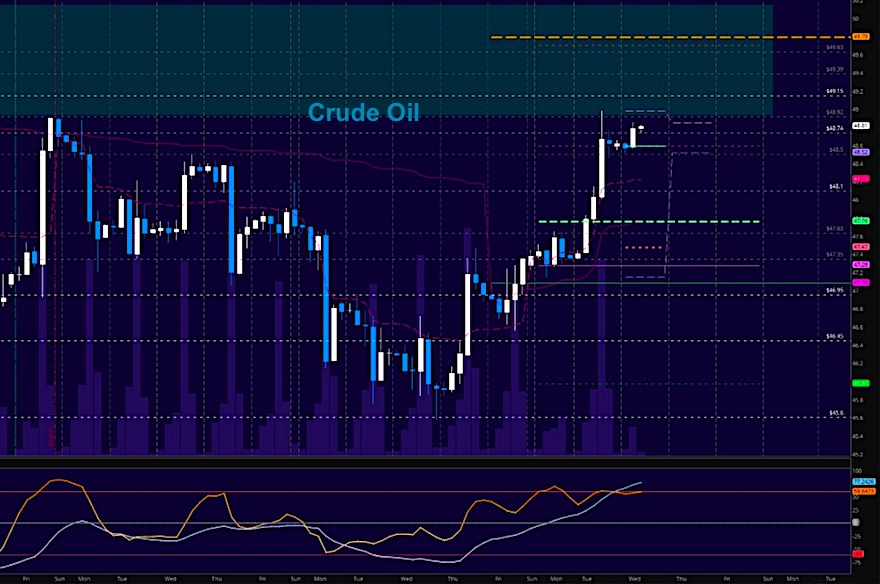
WTI Crude Oil
API after the close today due to the holiday schedule. We sit above resistance at this time and momentum is bullish. Buyers will have the upper hand as long as we hold 48.5. The bullets below represent the likely shift of trading momentum at the positive or failed tests at the levels noted:
- Buyingpressure intraday will likely strengthen with a positive retest of 48.92
- Sellingpressure intraday will strengthen with a failed retest of 48.5
- Resistance sits near 48.86 to 49.15, with 49.39 and 49.79 above that.
- Support holds between 48.52 to 48.25, with 47.76 and 47.47 below that.
If you’re interested in the live trading room, it is now primarily stock market futures content, though we do track heavily traded stocks and their likely daily trajectories as well – we begin at 9am with a morning report and likely chart movements along with trade setups for the day.
As long as the trader keeps himself aware of support and resistance levels, risk can be very adequately managed to play in either direction as bottom picking remains a behavior pattern that is developing with value buyers and speculative traders.
Twitter: @AnneMarieTrades
The author trades stock market futures every day and may have a position in mentioned securities at the time of publication. Any opinions expressed herein are solely those of the author, and do not in any way represent the views or opinions of any other person or entity.


