THE BIG PICTURE
The broader stock market remains in an uptrend, while geopolitical risks continue to linger. The best thing to do is follow the price action and avoid anticipation due to “noise”. If/When we correct, your process should stop you out of the trade. Without further adieu, here’s my weekly trading outlook.
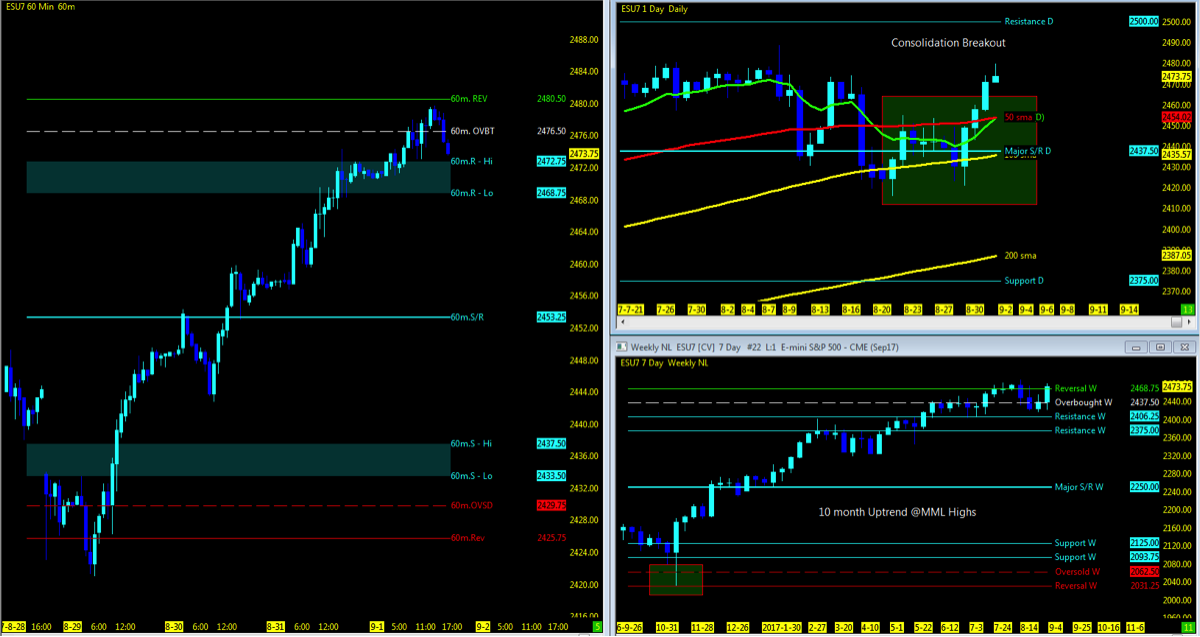
S&P 500 Futures (ES) – Macro Outlook – Week 36 (week of September 4)
INDEXSP:.INX
A Note On Using MML Charts – Using the Murray Math Level (MML) charts on higher time frames can be a useful market internal tool as price action moves among fractal levels from hourly to weekly charts. Confluence of levels may be levels of support/resistance or opportunities for a breakout move. Optimal setups will pass through Resistance or Support prior to moving in the opposite trend.
Technical Trends…
- See my Week 35 recap and trend charts
- Indices momentum remains upside
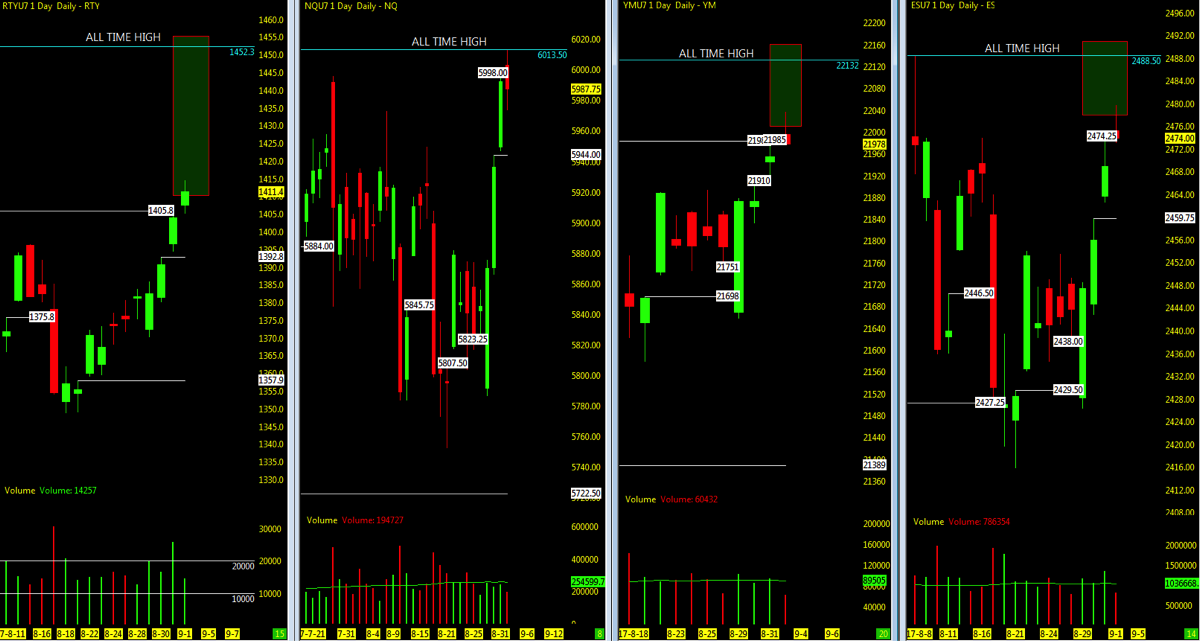
- Nasdaq futures (NQ) hit all time high and S&P 500 futures (ES) and Dow Jones Industrials futures (YM) within a days solid trend upside
- The VIX Volatility Index (INDEXCBOE:VIX) levels holding at the low 10’s
- FANG/FAMMG stocks just off their 52 week high as APPL sitting at all time high
- Indices holding at 60m MML Zone High
- As of Sunday open; Gap down
- The ES, NQ, and Russell 2000 (INDEXRUSSELL:RUT) with nearest open gaps downside (see open gaps chart below)
- Stock market indices major key moving averages in sync with 10>50>200
- NQ leading momentum back upside
- Crude Oil trend now range bound between 10/50 period moving averages at the MML 50% level
- 46.88 break can retest 43.75 level if unable to hold on 60m chart at 45.5-46.09; 50 target upside
- Daily Gold futures trading at MML highs
- Watch price to hold above 10ema; downside watch 50ma and MML 50% @1250 if it breaks 1312.5
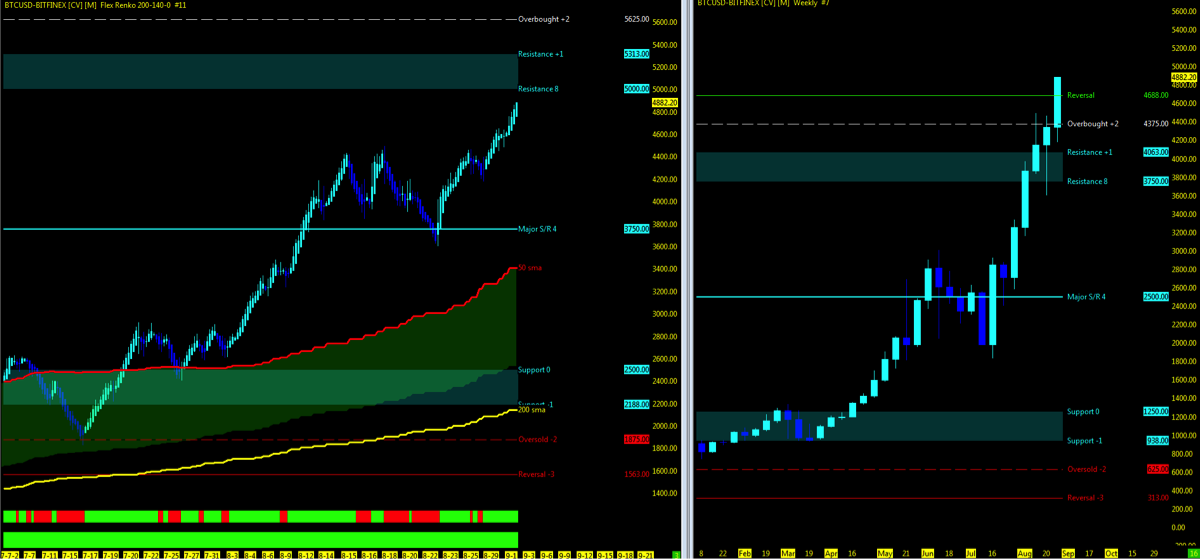
- Bitcoin (CURRENCY:BTC) up to range MML highs as weekly breakout above after 2 week consolidation
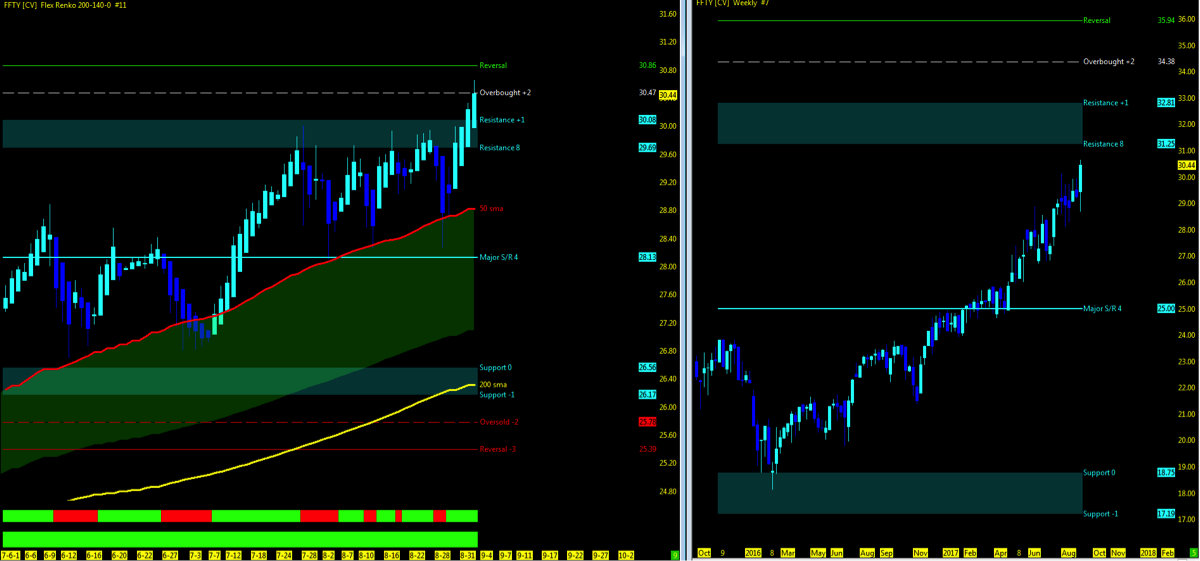
- Current IBD Outlook: Confirmed Uptrend
- IBD 50 ETF (FFTY) at range chart MML highs with weekly resistance low just above
Key events in the market this week
- Fed Speakers, Beige Book, Contract Volume Rollover
- ETF Conference at end of week
- Kroeger, Dell earnings report
- APPL event coming September 12th
THE BOTTOM LINE
Technical Momentum probability on the indices remains in an UPTREND.
With a holiday session on Monday, look for the month of September to be loaded with possibilities as key events will be forthcoming. As much as in the end the market only truly cares about is the the companies represented in the indices and their bottom line, global events will surely always play a minor setback as we are watching the events unfold with North Korea. It is my belief that based on my readings and not the media as my main resource, nothing will come of the tension and all will eventually be resolved. I could always be wrong also and that is why I remain with the status quo of uptrend is the play with an opportunity to buy even more if we pullback in the long term picture. Intraday…always ready in both directions.
To confirm a downtrend on the bigger picture (daily to weekly), watching for price momentum to lose support off the 10 and 50 and the crossing of the 50 over the 144ema would confirm a high probability of further selling downside which has yet to occur as we hold above all 3 key moving averages. As long as price remains above the 10ema, the short term trend will keep us above the longer term averages.
Lower open gaps remain on all stock market indices with none above except all time highs to watch for. Watch for 2459 open gap/100ma on the ES down to MML levels around 2375 which would put the market in the zone just under the 200ma; surely a test point. Upside momentum will need to hold above the 10/50ma and back upside to all time highs. 2500 would be the next upside level to watch. As I said last week, consolidation was the decision point and waiting till that breakout may be the best patience was answered and now it’s an issue of holding that level.
By the Murray Math Levels (MML), which in combo with the T3 strategy has shown what it takes to remain in the trend, surely has been an indicator of choice for key levels to watch for pullbacks and support levels.Week 34 was a perfect low to high drive off the MML lows as we closed out the week at the MML highs on the futures and indices ETF’s. Looking for the pullback on the smaller time frame to splice back in to the uptrend will be the key if we hold at the MML 50% to low zone and moving average support. Intraday shorts will trend well to test these levels.
Watch for Fed speakers and Beige book in economic highlights for the week. Heads up as future contracts volume begins to rollover to the December and summertime trading starts to end as we being the historical September to December time of year, a Trader’s Almanac favorite to comment on . FOMC will be in the scopes as well if they will raise interest rates for the third time in 2017.
I will notify through social media and my daily outlook; posted 30 minutes prior to the US open of any updates throughout the week.
LOWEST OPEN GAPS
- S&P 500 Futures (ES): 1589
- Nasdaq Futures (NQ): 3864.75
- Dow Industrials (YM): 14745
Attempting to determine which way a market will go on any given day is merely a guess in which some will get it right and some will get it wrong. Being prepared in either direction intraday for the strongest probable trend is by plotting your longer term charts and utilizing an indicator of choice on the lower time frame to identify the setup and remaining in the trade that much longer. Any chart posted here is merely a snapshot of current technical momentum and not indicative of where price may lead forward.
Thanks for reading and remember to always use a stop at/around key technical trend levels.
Twitter: @TradingFibz
The author trades futures intraday and may have a position in the mentioned securities at the time of publication. Any opinions expressed herein are solely those of the author, and do not in any way represent the views or opinions of any other person or entity.

 Rolling Over At Key Fibonacci Level?")


