S&P 500 Trading Outlook (2-3 Days)- BEARISH
Tuesday’s selloff was bearish for the S&P 500 (NYSEARCA:SPY) in undercutting near-term support, but it managed to hold 2455 by the close which is at least a key level to hold for now.
The fact that both Technology (NASDAQ:QQQ) and Financials (NYSEARCA:XLF) fell is a negative. Overall, under 2443 should allow for acceleration down to retest 2415, while OVER 2462-3, the area of the breakdown.. is a mild positive with movement above 2471 carrying S&P back to new highs. For now, the trend remains more bearish than bullish, but the next few days should decide the bias.
Technical Thoughts
US Equities appear to be at a crossroads, where Stocks are beginning to show greater amounts of weakness again, and are on the verge of confirming Daily Exhaustion signals as part of their ongoing uptrends from late August. However, Treasury yields and the US Dollar are close to getting these same signals as BUYS which would help these start to bottom out and trend higher.
So which trend wins out? The next couple days will speak volumes as to the near-term direction. Any further weakness back under 2453-5 and undercutting 2443 puts the bearish acceleration view clearly on the front burner and is something to watch.
However the act of regaining last Friday’s highs would actually be a mild positive and potentially result in near-term strength into next week before weakness unfolds again.
Overall, the counter-trend signs on US Dollar, Treasury yields and Gold seem to be arguing for an upcoming LESSENING in TENSION, which has EVERYTHING to do with North Korea and less to do with Hurricane Irma which is now barreling towards the Florida Shoreline. Signs of any type of “EASING” in tension would likely allow for yields to turn back up, coinciding with the Bond selloff while Gold peaks and the Dollar turns back up.
Of course, all of these require that equities “hang in” and do NOT selloff any more. A rapid decline puts stabilization in any of these immediately OFF the table, despite the counter-trend signs.
The real positive for Tuesday had to do with WTI Crude oil turning positive, which reinforced some of the thoughts given in Monday night’s Weekly Technical Perspective. This minor breakout in Crude bodes well for WTI to advance near-term and for Energy to potentially follow suit. Given the bearish momentum and trend, this is a hard bargain, but looks possible after the positive surge in Crude over the last few days, while S&P Energy index was one of the few gainers in trading on Tuesday.
S&P 500 Futures Chart
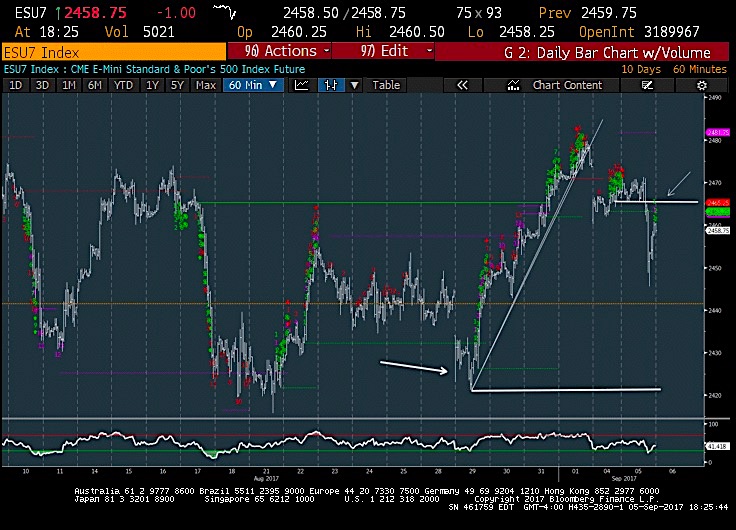
The S&P 500’s breakdown failed to get under 2450-5, an area that’s right near the 50% retracement of the rally up from last week. This level also lines up with prior HIGHS from 8/22-5, which gives it additional importance. However, the rally is now back up to the area near yesterday’s breakdown. So as with everything, its better to know the areas where one is WRONG, and know one’s risk. Over prior lows at 2463-5 and particularly above last Friday’s 2471, this would have a decidedly UPWARD bias back to highs. For now, the trend is near-term negative on yesterday’s break, and any move back UNDER 2443-5, particularly on a close, would argue for a retest, immediately, of prior lows, at 2412-5. QQQ, and NASDAQ Comp could both confirm counter-trend sells by not immediately rising over the next two days, so this would be something to keep in mind.
Financial Sector ETF (XLF)
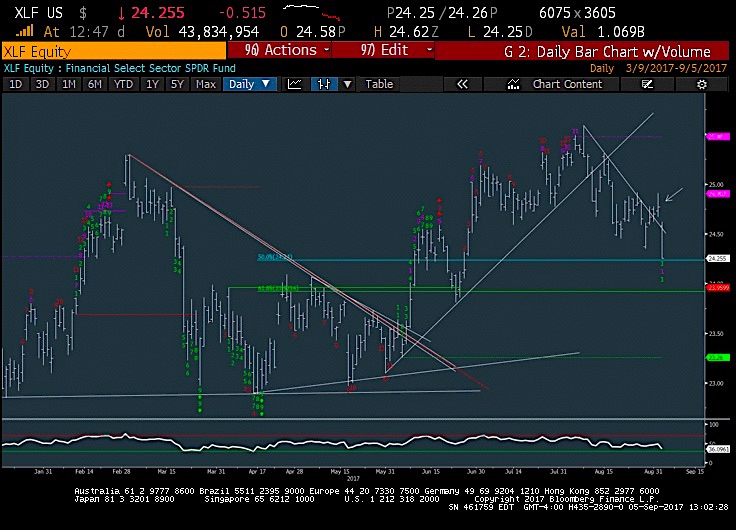
The false breakout near-term in Financials is one factor that still supports the bearish case, and heading into this week, was thought to be a minor positive ahead of the sharp downdraft Tuesday. 10-year yields plummeted down to 2.08, the lowest levels of the year, but are now within 1-2 days of potentially getting counter-trend signs of exhaustion after this drop. Overall, it will likely take a move back over 2.13 to help jump-start the Financials again, which have fallen out of favor given the plummeting in Yields and massive flattening in the 2s/10s curve. XLF has now retraced 50% of the rally off April lows, but very well could move down to 23.92-4 before finding any support. At present, if this sector is going down, it’s tough to see how the headwind doesn’t also affect the broader market. Yields could pullback to 2.000-2.02%, so in this scenario, Financials likely weaken a bit more. Only over 24.77 would this prove to be a false breakdown.
If you are an institutional investor and have an interest in seeing timely intra-day market updates on my private twitter feed, please follow @NewtonAdvisors. Also, feel free to send me an email at info@newtonadvisor.com regarding how my Technical work can add alpha to your portfolio management process.
Twitter: @MarkNewtonCMT
Author has positions in mentioned securities at the time of publication. Any opinions expressed herein are solely those of the author, and do not in any way represent the views or opinions of any other person or entity.


