Consumption Exhaustion
When people use the word catalyst to describe an event that may prick the stock market bubble, they usually discuss something singular, unexpected and potentially shocking. The term “black swan” is frequently invoked to describe such an event. In reality, while such an incident may turn the market around and be the “catalyst” in investors minds, the true catalysts are the major economic and valuation issues that we have discussed in numerous articles.
Most recently, in 22 Troublesome Facts, 720Global outlined factors that are most concerning to us as investors. As a supplement, we elaborate on a few of those topics and build a compelling case for what may be a catalyst for market and economic problems in the months ahead.
Debt Burden
Debt serves as a regulator of economic growth and is the focus of ill-advised fiscal and monetary policy. It is no coincidence that no matter what economic topic we explore, debt is usually a central theme. Illustrated in the chart below is the actual trajectory of total U.S. debt outstanding (black) through March 2017 and a calculated parabolic curve (red). The parabolic curve uses 1951 as a starting point and a quarterly 1.82% compounding factor to create the best statistical fit to the actual debt curve. If we start with the $434 billion of debt outstanding on December 1951 and grow it by 1.82% each quarter thereafter, the result is the gray line. If debt outstanding continues to follow this parabolic curve, it will exceed $60 trillion by the first quarter of 2020, or nine quarters from now.
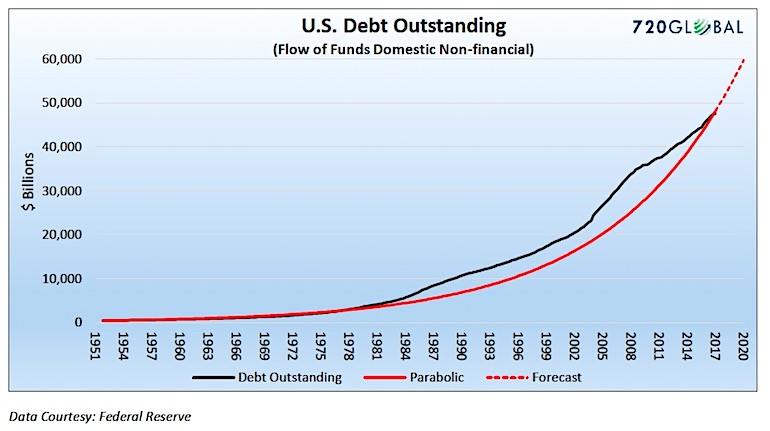
Many economists point to the stability of debt service costs as a reason to ignore the parabolic debt chart. Despite rising debt loads, falling interest rates have served as a ballast allowing more debt accumulation at little incremental cost. While that may have worked in the past, near zero interest rates makes it nearly impossible to continue enjoying the benefits of falling interest rates going forward. Importantly, social safety net obligations, demographics, and political dynamics argue that debt growth is likely to continue accelerating as implied by the chart above. Without interest rates falling in step with rising debt burdens, debt service costs will begin to rise appreciably.
The power of compounding, extolled by Albert Einstein as the eighth wonder of the universe, is as damning in its demands as it is merciful in its generosity. Barring negative interest rates, debt service costs will be an insurmountable burden by 2020. However, if the debt trajectory slows as it did in 2008 that too will bring about painful consequences. In other words, all roads lead to trouble.
Debt growth illustrated above has been an important cog in the consumption engine in the United States. Personal consumption accounts for about 70% of Gross Domestic Production (GDP) growth. Neo-Keynesian and Modern Monetary Theory (MMT) economists argue that those who worry about government debt and deficits just don’t understand deficit finance. We worry because we understand the basic math that will limit the U.S. economy’s ability to further burden itself with debt.
Despite policymakers’ lack of regard for this burden, it is important to keep in mind that, as debt accumulates and consumers become less capable of repaying those debts, deleveraging ensues. This means that households will become unable to sustain the lifestyle to which they have become accustomed. Whether debts will be resolved through repayment or default, economic progress will falter.
Retail Sales
The chart below illustrates the components of retail sales in July 2017. Retail sales measures the dollar amount of finished goods sold as opposed to the Personal Consumption Expenditures index (PCE) which measures the price changes of consumer goods and services.
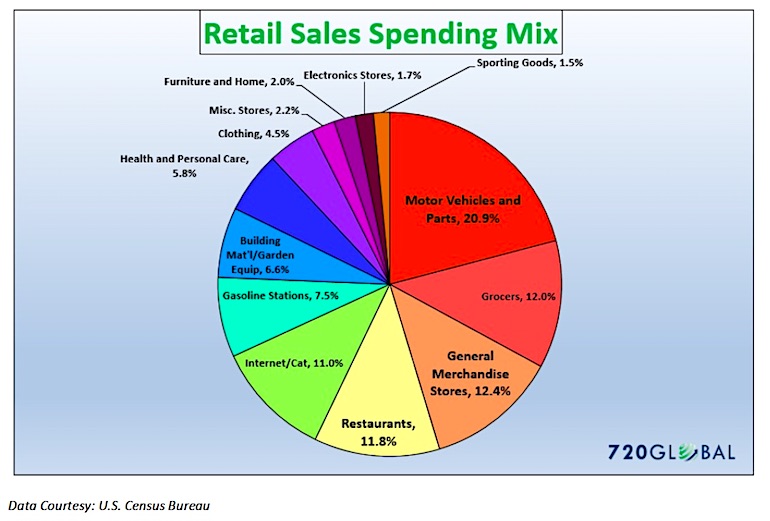
As shown above, autos, department stores (general merchandise) and restaurants account for 45% of total retail sales. If any of these sectors exhibit weakness then it is challenging for another sector to offset that weakness given its relative size. If all three of these sectors soften at the same time, as is happening now, then it serves as a warning that consumption is likely to decelerate. This has been a precursor to broad economic weakness and even recession in the past. The sections below review each of these three sectors to help you assess the underlying strength or weakness of these important drivers of consumption and the economy.
Autos
Car and truck sales helped lead the economy out of the recession over the past eight years. The surge in sales to new record levels was not solely due to outright sales but was heavily nourished by extensive use of lease financing. As shown below, auto sales appear to have peaked in late 2016, and used car prices have been in decline since 2014. Both factors raise concerns over the auto sector’s future contribution to economic growth.
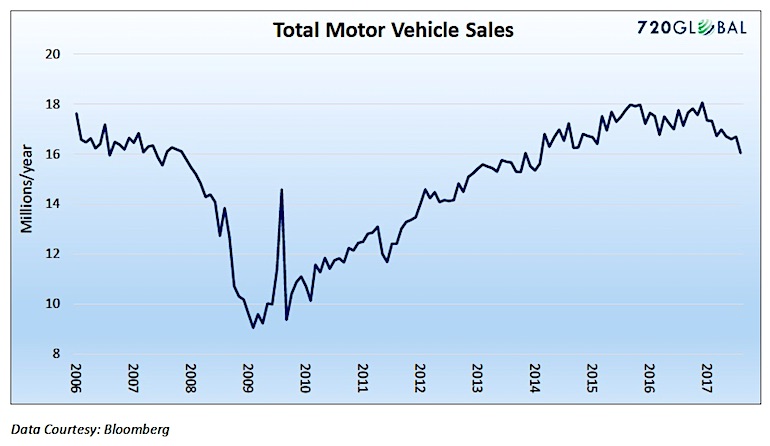
Because of the reliance on leasing, cars rolling off leases topped 4 million units last year and are expected to rise by 11% in 2017 and 2018 and top 5 million units by 2019. This is producing a glut of used cars on dealer lots and fueling the decline in used car prices. Projected used car prices, also known as residual value calculations, are a major component of the lease finance equation. As 11-12 million used vehicles hit the market over the next 2½ years, the stage is set for problems in the leased vehicle market and total car sales.
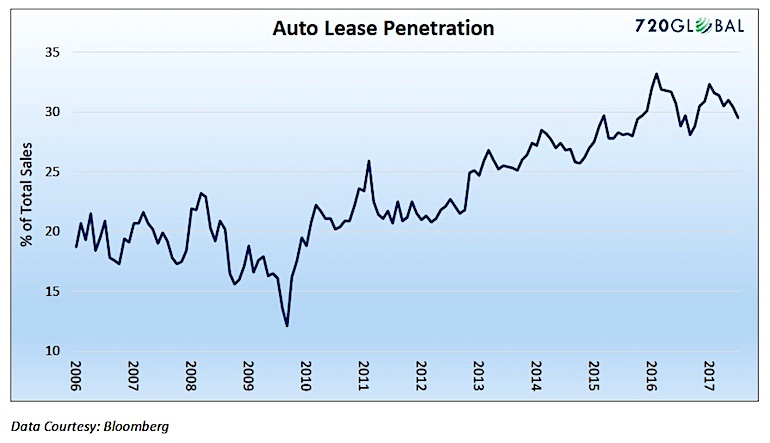
At their peak in February 2016, auto leases accounted for one-third of new car sales and the 6-month moving average remains above 30%. As the leasing option becomes more expensive and the used car supply continues to grow, new auto sales are likely to suffer.
continue reading on the NEXT PAGE…

: Showing Some Signs of Emerging Strength")
