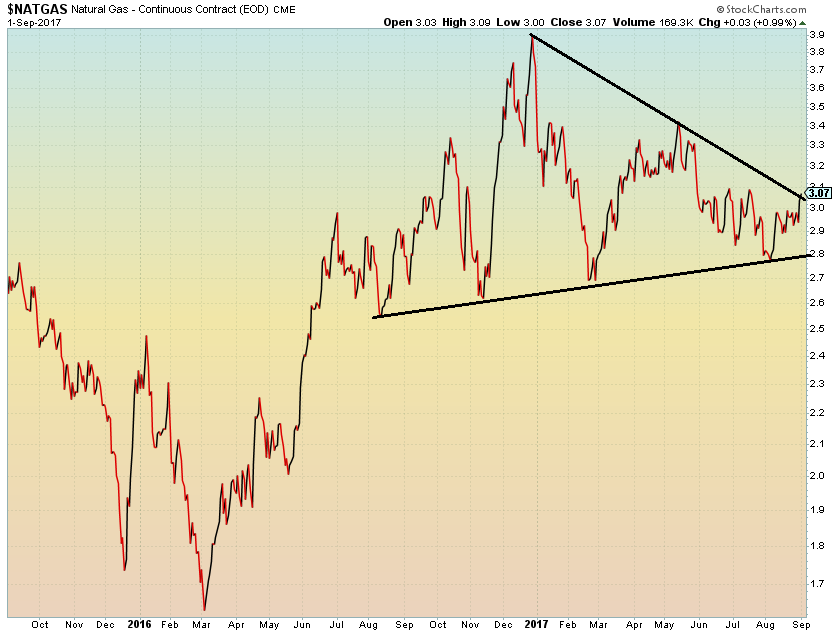
Natural Gas (NG) continues to trade in a range-bound manner in 2017. The prompt-month contract peaked on the final trading day of the year of 2016 near $4, but then dipped into the $2.60s in February 2017.
It has steadily coiled with higher lows and lower highs as the year has progressed. That’s take a look at the charts and try to frame the trading setup.
If we back out the chart to a 2-year zoom, it becomes evident that Natural Gas may be forming a symmetrical triangle pattern. This pattern would suggest higher prices as the trend of larger degree is upward following the 20-year low put in during March of 2016.
We will have to wait and see if the triangle pattern is indeed broken to the upside in the coming weeks. What is also interesting about this pattern is that it coincides with bullish seasonality.
Natural Gas Price Chart – Symmetrical Triangle
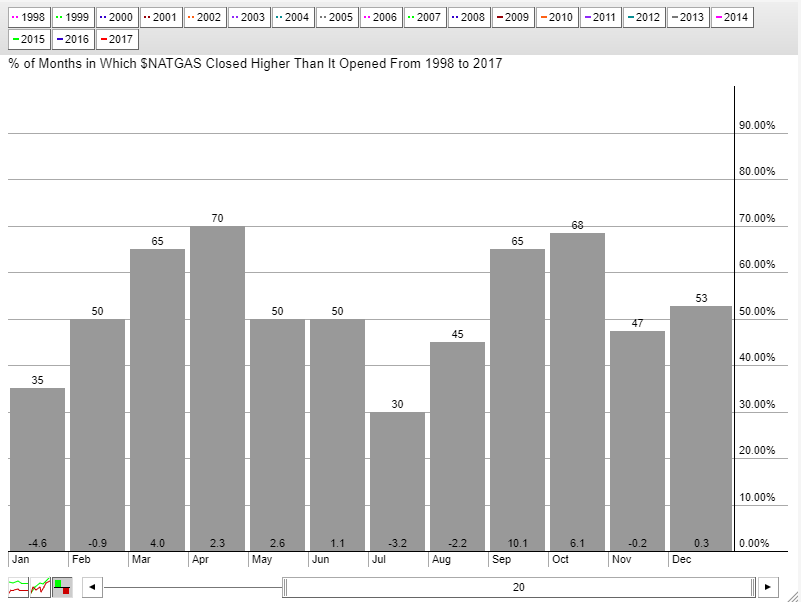
The next chart (below) is a monthly performance histogram for Natural Gas prices spanning the last 20 years from Stockcharts.com. It shows the remarkable bullish nature of September and October, with average gains of 10% and 6%, respectively. While seasonal trends should come secondary to price action for a technician, it is noteworthy that this bullish period of the year may occur with a breakout on the chart.
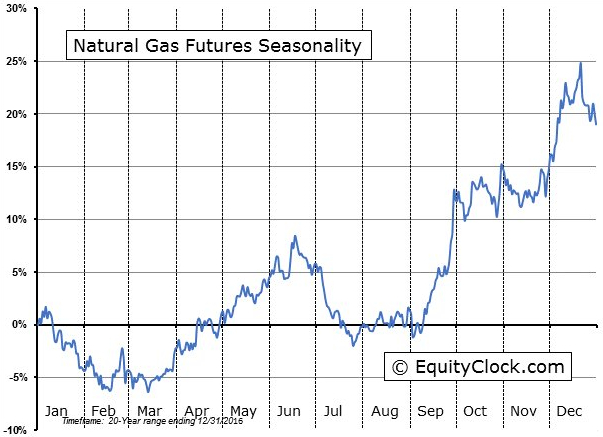
Another seasonal look comes from EquityClock.com, which puts the seasonality into an annualized line chart, using the same trailing 20-year period. See below.
As the chart indicates, September has been an exceptionally bullish month, followed by consolidation in October and November, then a final jump into the end of fall. What is interesting is how NG is actually technically weak during the strong physical demand periods of the year (winter and summer) and technically strong during the shoulder months (April, May, September).
Will seasonality play out once more in favor of NG? The price chart and historically seasonal patterns may be pointing to upside this fall. Thanks for reading.
Twitter: @MikeZaccardi
Any opinions expressed herein are solely those of the author, and do not in any way represent the views or opinions of any other person or entity.

: Showing Some Signs of Emerging Strength")

