Weighing the Crude Oil Decline and Select Energy Sectors
One of the big standouts in the month of October was the decline in crude oil and energy stocks.
All of a sudden, good charts...
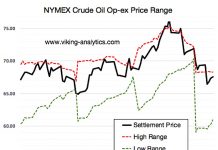
The Limitations of Max Pain Theory For Options Traders (into Op-ex)
The Max Pain theory suggests that stock and commodity prices will often move towards specific prices on specific option expiration dates. “Max pain” is the price...
Oil Market Price Dynamics: Loved or Unloved?
Try painting a better picture for the Canadian dollar. Our economy is humming along with the data often surprising to the upside of late.
Global...
COT Report: Is Gold Basing For A Broader Rally?
The chart below looks at non-commercial futures trading positions for Gold (NYSEARCA: GLD). For the week Gold closed higher by +0.5%, consolidating recent gains.
Here’s a look...
Is All That Glitters Gold?
The following article is a part of my Gone Fishing Newsletter that I provide to fishing club members each week to identify macro inflection points and...
Stock Market Futures Update (October 17): Bulls Defend Price Support
Resistance levels brought sellers out on the S&P 500 and Nasdaq futures this morning... but bulls are defending key support levels.
And the bounce lives...
Macro Market Trends Blur As Equities Hit Oversold Levels
On a closing basis, the S&P 500 has regained the 200-day moving average after finishing below on Thursday.
The 50-day moving average has begun to...
A Warning To Crude Oil Bulls?
Readers at See It Market know we have been looking for a significant top in crude oil prices.
We posted charts in early June for the...
Gold Prices Break Out But Overhead Resistance Looms
The chart below looks at non-commercial futures trading positions for Gold (NYSEARCA: GLD). For the week Gold closed higher by +1.4%, breaking out above key...
Crude Oil: Will October Mark A Bearish Reversal and Double Top?
Crude Oil prices are taking it on the chin in October... following stocks to the downside.
Depending on how Oil prices close the month, this...


