Try painting a better picture for the Canadian dollar. Our economy is humming along with the data often surprising to the upside of late.
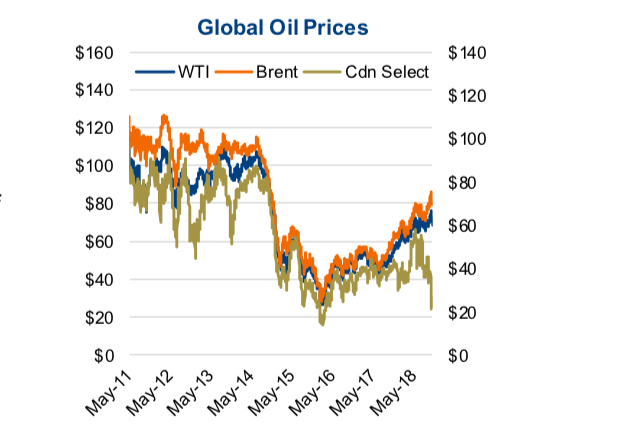
Global oil prices are up 30% over the last year, the fear of NAFTA falling apart has largely subsided, and despite this backdrop, the Canadian dollar is still down nearly 5% over the last year against the U.S. dollar.
Many are looking inquisitively at the disconnect and searching for a potential reversion trigger. One factor that is starting to garner more attention is oil prices (NYSEARCA:USO).
For our friends in Alberta, it is painfully clear the rise in oil prices over the past year was not a Canadian phenomenon. Prices of oil out of Cushing Oklahoma (WTI) may be up 35% over the past year, rising from $52 to $70, but Western Canadian Select (WCS) has dropped 38% from $40 to $26/barrel.
This has the spread between WTI and WCS near record levels (chart 1 below).
The differential in prices arises from a number of contributing factors. On the demand side, there has been a significant drop related to the maintenance schedules at a number of U.S. refineries, notably in the Midwest. Maintenance is done to switch over from producing more gasoline to more heating oil for the winter. Plus refineries get dirty and need maintenance, which typically occurs at this time of year.
It would appear this has temporarily reduced demand for the heavier WCS oil, contributing to the price differential, a pattern not uncommon this time of year. Then there are longer-term demand issues with an upcoming change in sulfur content regulations for global shipping companies. This may tilt the demand dynamic, reducing demand for heavy oil and increasing demand for lighter oil (note that light versus heavy is often referred to as a function of the sulfur content). This change, not in effect until 2020, appears to already be increasing the differentials globally for heavy oils, not just ours.
Arguably the biggest weight on Alberta oil prices is attributable to Canada’s inability to get oil to the global market. Years of stagnation from policy-makers have delayed pipeline approval and construction. However, we do finally see some light at the end of the tunnel or in this case, pipe.
Enbridge is expecting Line 3, its $5.3-billion-dollar pipeline from Alberta to Wisconsin, to be operational by the second half of 2019. Keystone XL will move oil from Hardisty, Alberta to Steele City, Nebraska. Construction is set to start next year, more than a decade after TransCanada and ConocoPhillips originally announced the project. Still, Western Canadian Select is trading at an extremely wide differential to its Cushing counterpart. The differentials with global prices are even worse (chart 2 below).
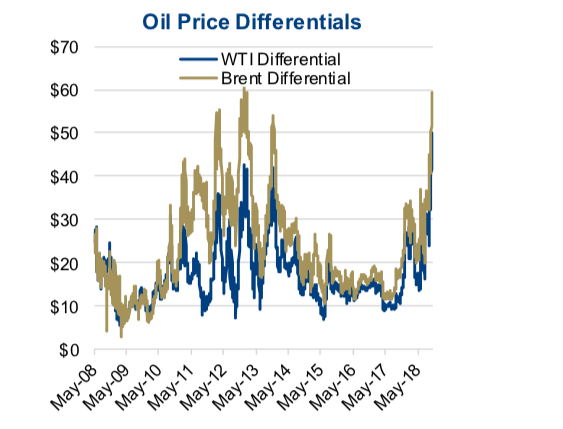
The Canadian curse comes from our inability to efficiently move heavy oil to refineries in the Midwest. The story for the U.S. differential (Brent – WTI) is somewhat the same. Areas such as the Permian Basin in western Texas and southeastern New Mexico do not have the necessary take-away capacity to move oil to the Gulf Coast. On the other side, overseas supply has been hampered by impending sanctions against Iran, production woes in Venezuela and OPEC limiting supply to the market. The outlook for demand growth is still positive, even though China is signaling alarms because of its “anemic” 6.5% GDP growth (We use quotes to denote sarcasm, as 6.5% growth in the world’s second-largest economy is pretty good).
Despite pipeline constraints/concerns, the current WCS – WTI spread seems overblown.
We believe this is opening the door for certain market participants to make elevated
profits. The Efficient Markets Hypothesis, even in its weakest form, tells us that when prices do not reflect fair values, market participants will re-allocate to make profit and
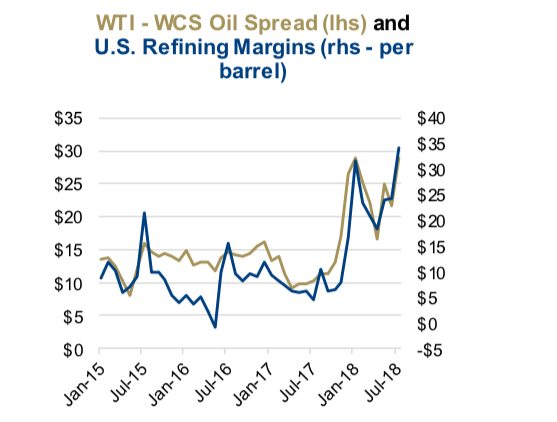
restore equilibrium. The thesis seems to be showing signs of truth, with the obvious winners, namely Canadian rail companies and U.S. refiners, making strong profits (chart 3).

During their earnings call last Thursday Canadian Pacific said they shipped three times the amount of crude by rail last quarter versus a year earlier. That fueled a 63% rise in revenue from the energy, plastics and chemical segment of their business. In mid-2016 when WCS was trading at just a $16 discount to WTI, crude oil shipments by rail from Canada to the U.S. hit a low of about 50,000 barrels. Today, at a $40+ spread, we are shipping roughly 200,000 bpd southbound. The winner on the other end is U.S. refiners, which are making record netbacks (chart 4 below).
The spread widening has also caused a dislocation in the prices of Canadian versus American exploration and production companies.
Our investment approach tends to blend traditional economics with behavioral finance.
Both are at play here, presenting an opportunity for a mean-reversion trade, in which the
gap closes (see chart 1). A reduction in the differential probably would not add a nickel to the loonie. Even so, it would likely pivot the focus back to the Canadian economy, which has been fairly strong. A healthy economy leads to lower unemployment and supports the Bank of Canada’s rate-hiking regime. The market is currently pricing in four rate hikes over the next 12 months. Higher interest rates should lead to a higher foreign exchange rate, according to the interest rate parity model that we learned from the CFA curriculum.
Despite some positive tailwinds, the loonie is struggling to soar beyond the $0.77 level. A tightening of the gap between our oil prices and their global counterparts would almost
definitely help, at least in the short term. That said, oil is not the only thing to consider
when forecasting the Canadian dollar. Moreover, if any of the aforementioned tailwinds
subside then our currency could fall even lower.
Chart data sourced to Bloomberg unless otherwise noted.
Twitter: @sobata416 @ConnectedWealth
Any opinions expressed herein are solely those of the authors, and do not in any way represent the views or opinions of any other person or entity.


