Readers at See It Market know we have been looking for a significant top in crude oil prices.
We posted charts in early June for the United States Oil Fund (NYSEArca: USO) and again in mid-July for crude oil futures.
In the time since those posts, price has climbed above the resistance levels that we thought would be most important, but traders should not take that to mean oil prices will continue rising. Despite the series of higher highs this year, there is a strong probability that oil prices (and the USO) will start a sizable correction soon.
For the next one or two years, crude oil traders should think of the mid-2017 price low as marking the extreme lower boundary of the expected range. We do not believe price will actually test that level again, but it is the point where any downward retracement measurements should be anchored.
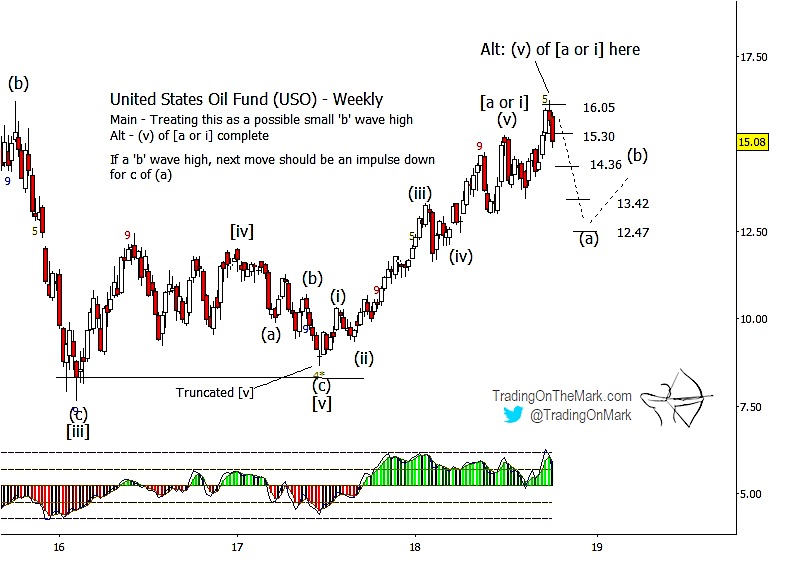
The move up from the 2017 low should present a five-wave structure – an impulsive move in Elliott wave parlance. If we consider that this formal requirement was met at the July high, the more recent higher high can be seen as a type of overshoot correction that should end badly for bulls.
In fact price has already pulled away from the 16.05 resistance level and is threatening to break the trend of the past several week..
(It may be possible to view the September high as the completion of a five-wave sequence, but that count is awkward and somewhat improbable. Anyway that is a nuance that might not matter to traders looking for small bearish continuations down from that high.)
The retracement supports drawn on the USO chart at 15.30, 14.36, 13.42 and 12.47 represent 1/8 increments of the move from the 2017 low. This gradation often works well with crude oil charts. In the bearish scenario we would expect price to consolidate around the 15.30 area before falling to test the next supports in a cascading fashion when seen with weekly candles.
The 12.47 area initially looks like a reasonable downward target for the next few months, and we will be able to refine it more as the new pattern segment becomes clear.
It’s an understatement to say markets are becoming more volatile. Stay on top of the moves with twice-daily updates at Trading On The Mark! Subscribers get charts and analysis for the Dollar Index, Euro futures, the S&P 500, crude oil, treasury bonds, and gold. Between now and October 31, new subscribers can lock in savings of 15% on all of our services. The promo code for the special offer is “fractal”.
Twitter: @TradingOnMark
The authors may have a position in the mentioned securities at the time of publication. Any opinions expressed herein are solely those of the author, and do not in any way represent the views or opinions of any other person or entity.

")


