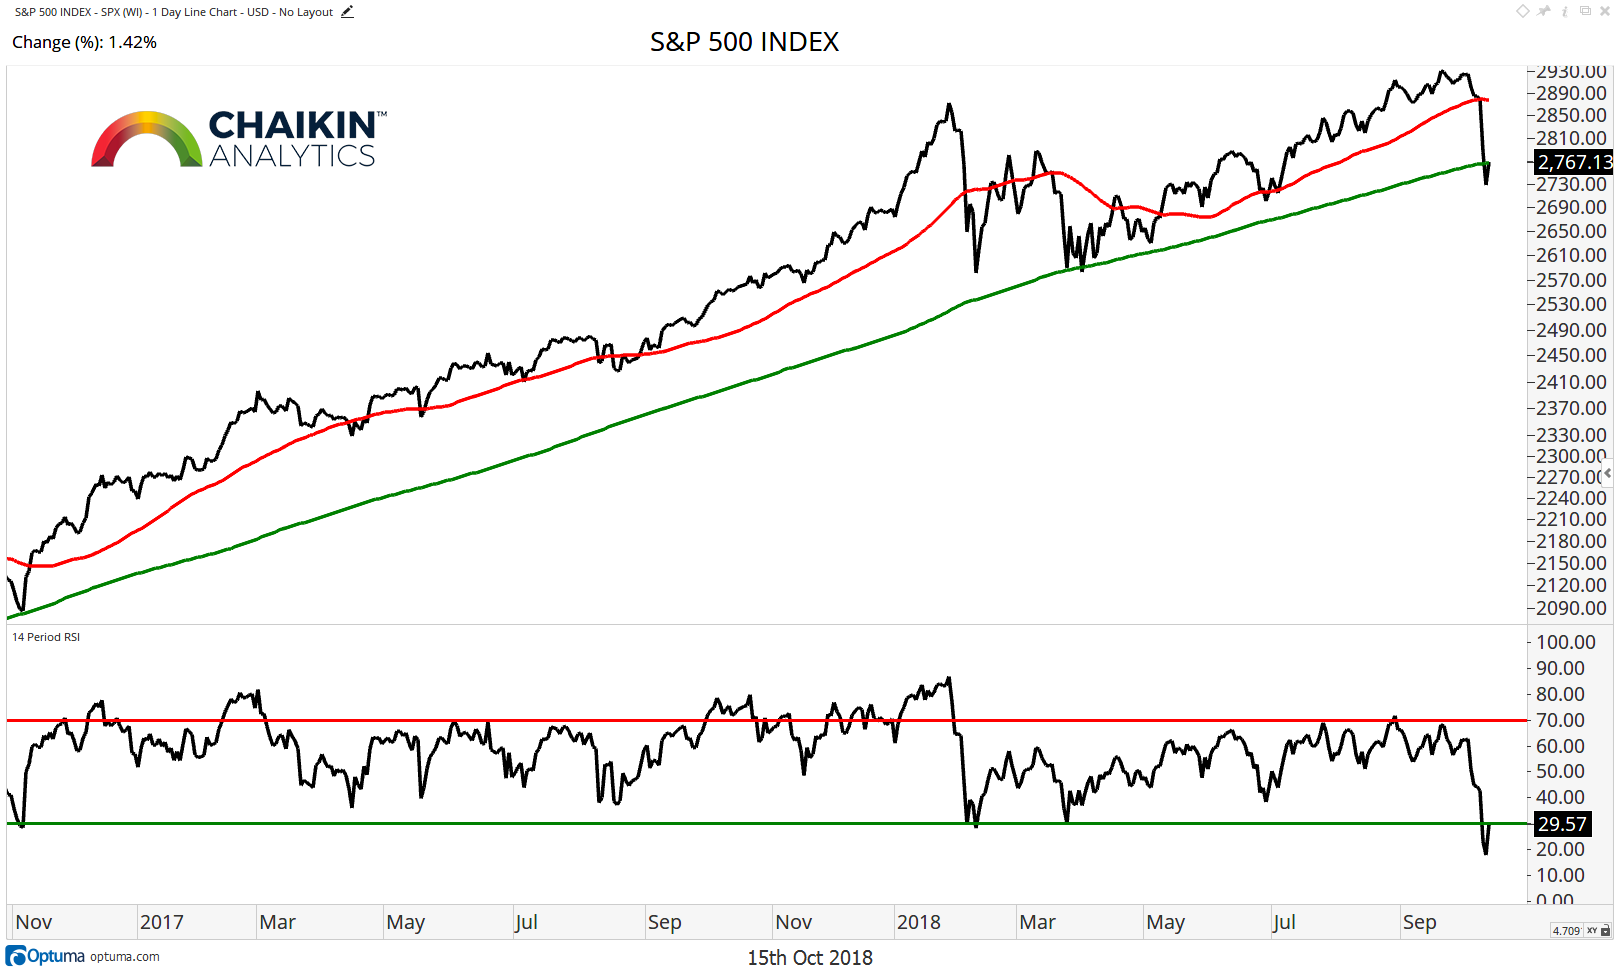
On a closing basis, the S&P 500 has regained the 200-day moving average after finishing below on Thursday.
The 50-day moving average has begun to turn lower in an indication that the short-term trend is now down.
The RSI has moved into oversold conditions for the first time since earlier in the year.
We have highlighted the zone in the 2,710 – 2,720 area as being important for the long-term structure of the market. Should this level break, the door is open to a move to 2,650 which would mark a 10% correction.
S&P 500 Chart
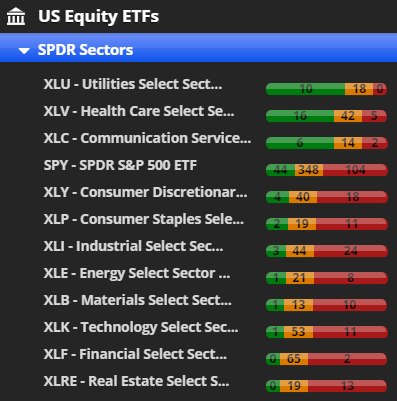
S&P 500 & Sector Power Bars
The Power Bar for the SPY turned bearish with the move lower in the equity market last week. At the sector level, the defensive nature of the Utilities Sector (XLU) has moved that group back to the front of the pack but we have to wonder if they will be able to maintain this position should interest rates continue to rise. Health Care (XLV), certain parts of which can also be considered defensive, remains in the top three as the services stocks continue to outperform the market.
Finally, Communications Services (XLC) rounds out the sectors which have bullish Power Bar Ratios and are ahead of the SPY. There are eight sectors of the market which have bearish Power Bar Ratios which are also weaker than the SPY. Real Estate (XLRE) remains at the bottom of the list and does not have any stocks with a Very Bullish or Bullish Chaikin Power Gauge Rating. The same is true for the second weakest sector, Financials (XLF). The weakness in Technology (XLK) shares has dropped that sector into the bottom three with only one stock rated Very Bullish or Bullish.
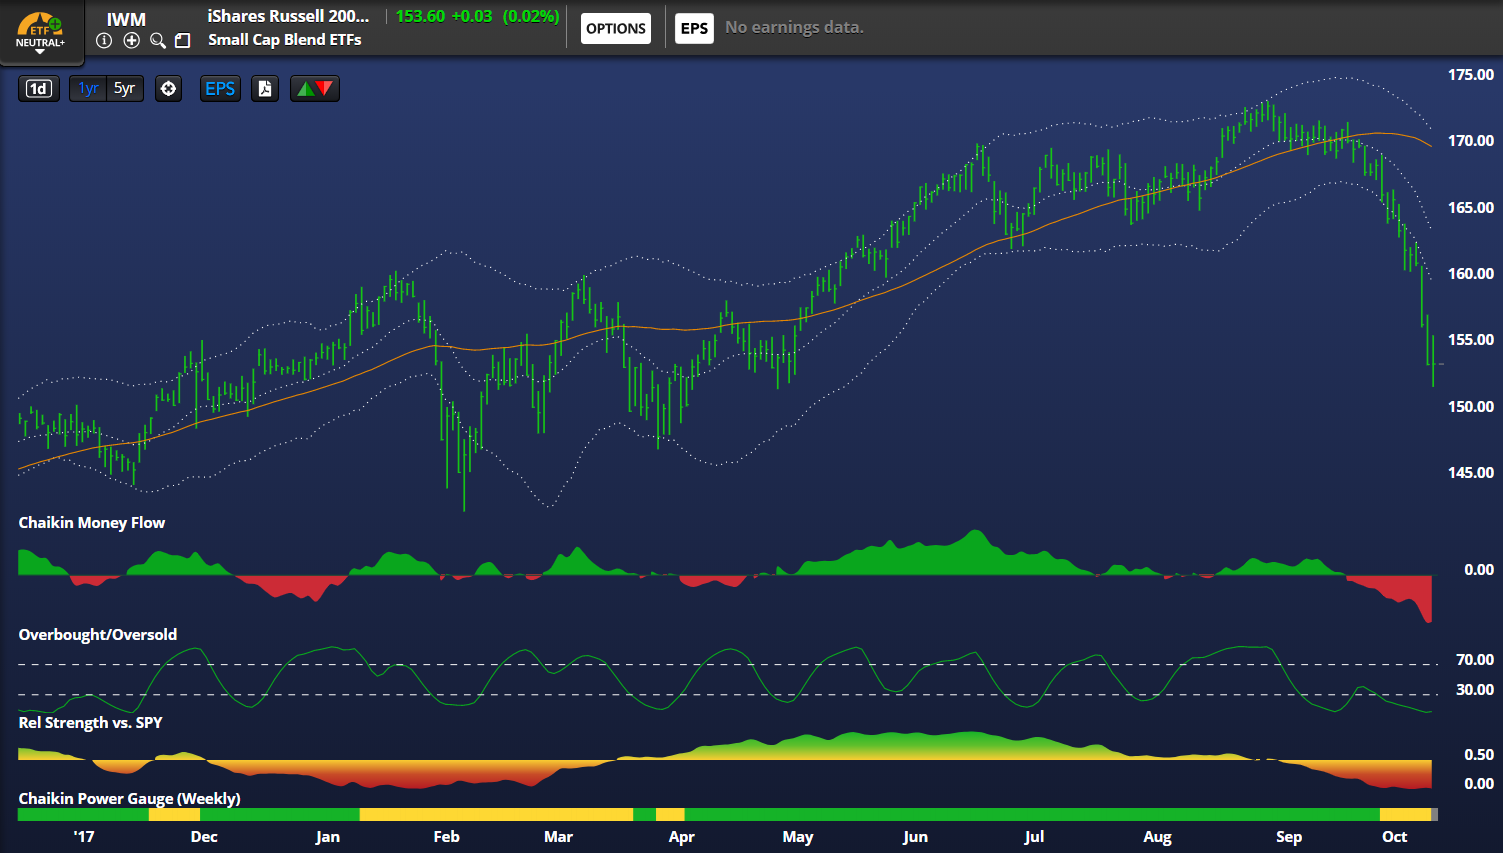
Small Caps Continue to Lag
The iShares Russell 2000 ETF (IWM) continues to underperform the SPY but is nearing support in the $150 – $152 zone on an absolute basis. The fund is oversold based on our Overbought / Oversold Indicator and Chaikin Money Flow is extremely bearish. The IWM has a Neutral + Rating.
![]()
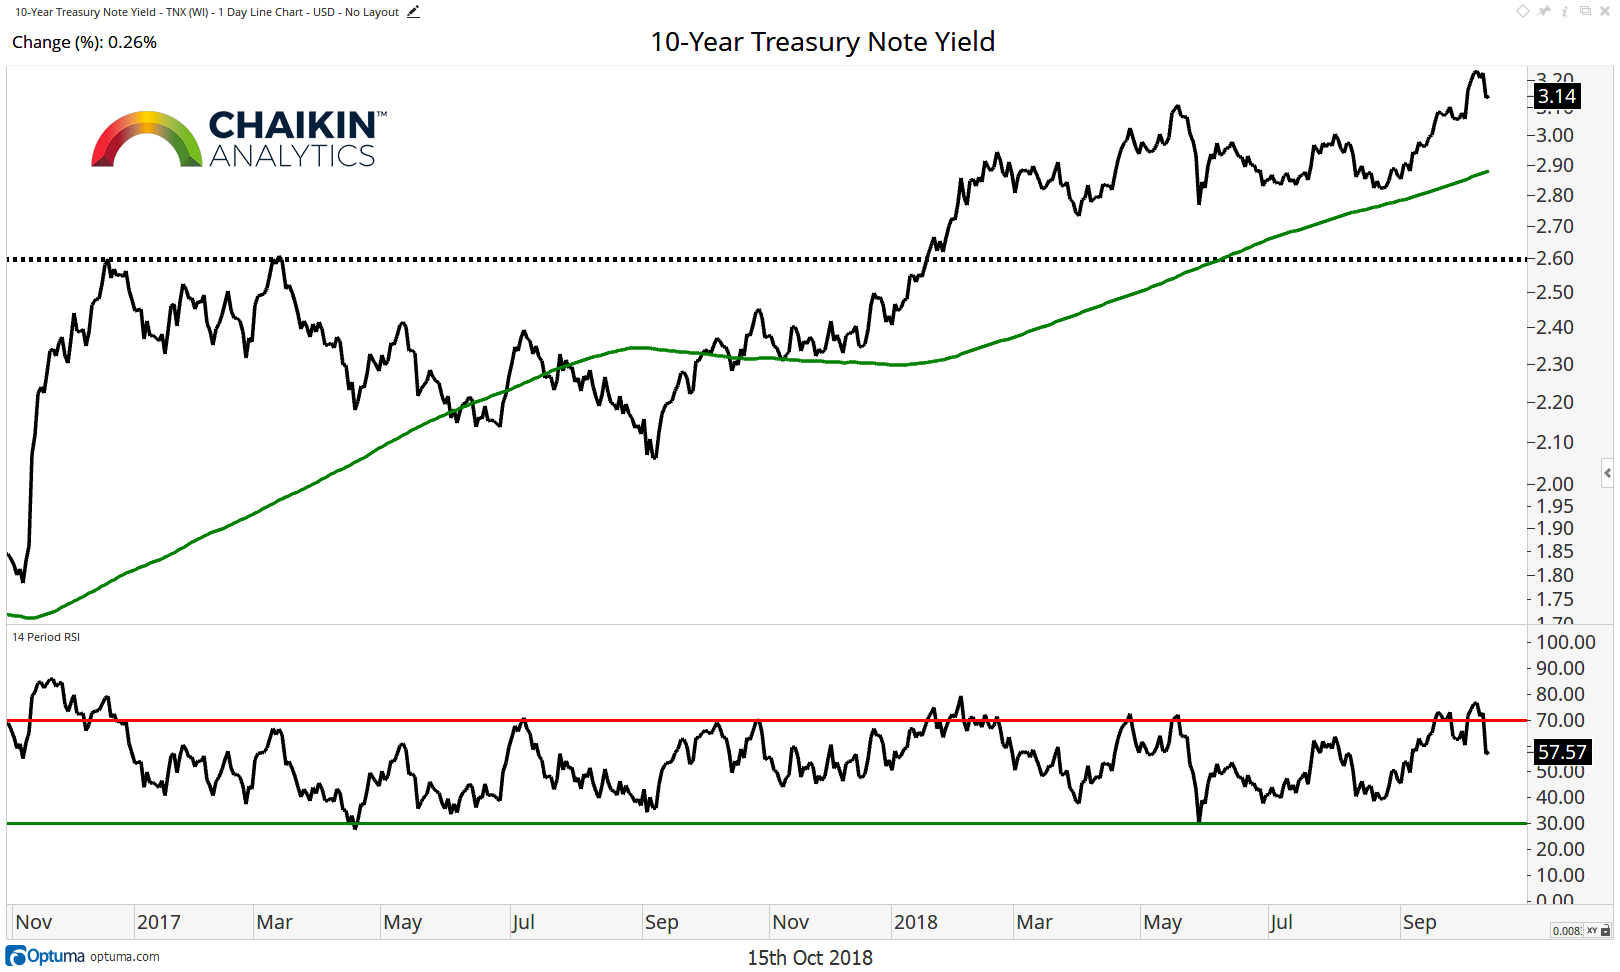
Credit
The 10-year yield remains above the breakout level of 3.1% after pulling back over the course of last week. Yields remain above the rising 200-day moving average while the RSI resolves an overbought condition. The path for rates remains higher in the intermediate-term. As rates rise, the overbought Utilities sectors are likely to see some profit taking.
Commodities
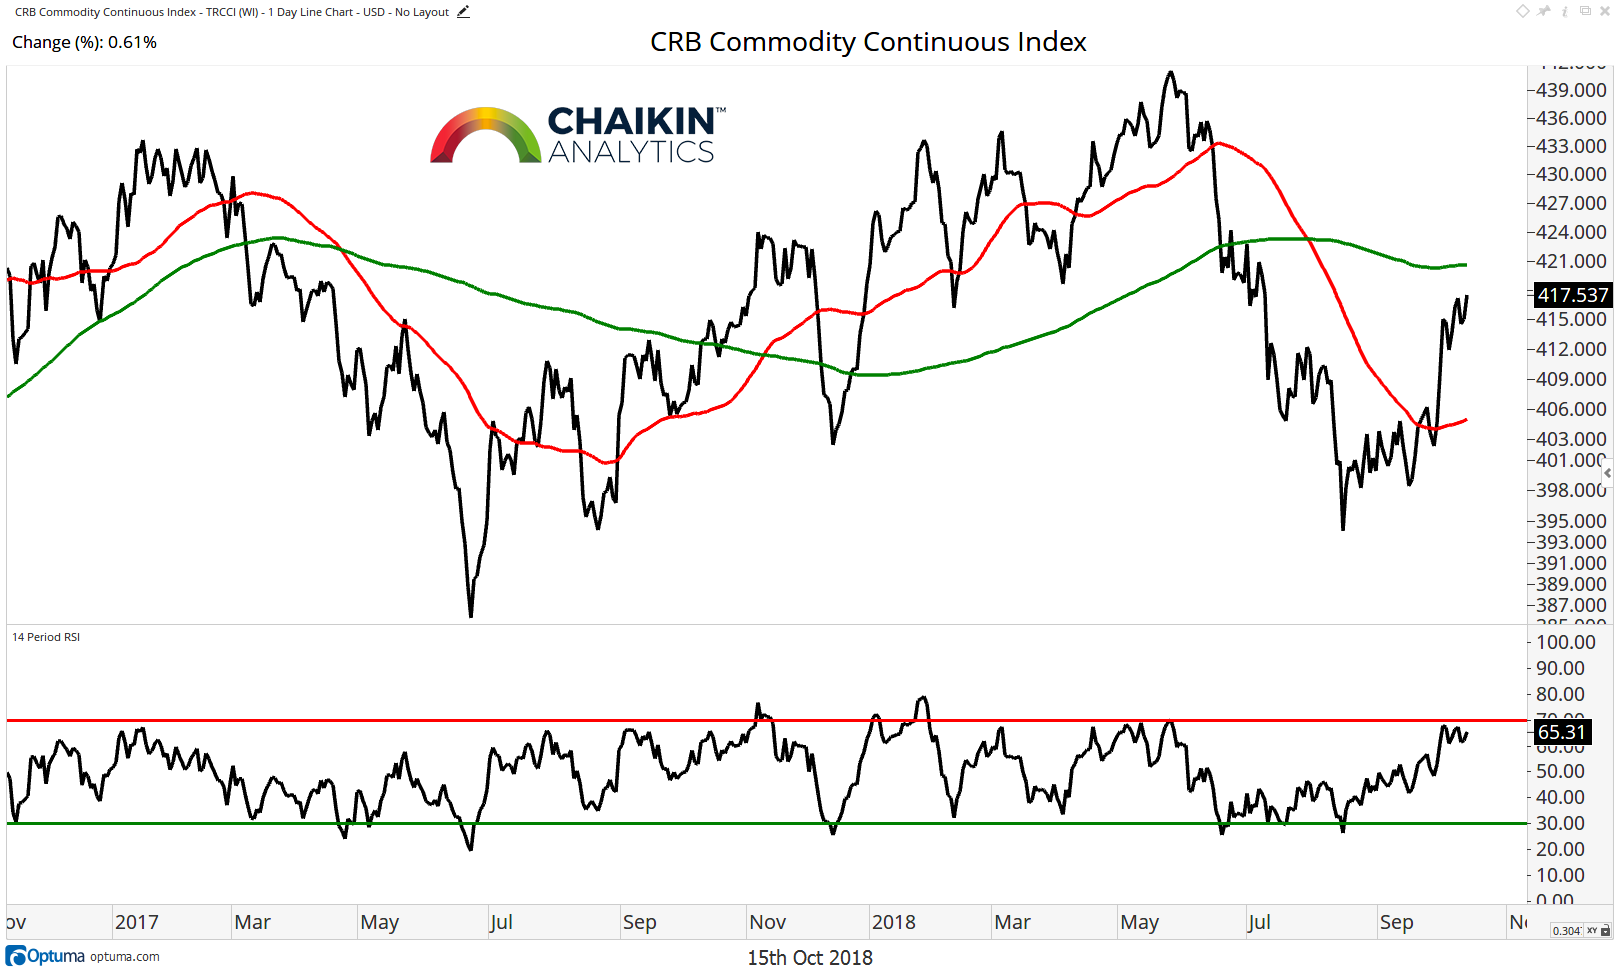
The CRB Commodity Index followed through on its large advance from the previous week. The index has broken through the 50-day moving average but remains below the falling 200-day moving average. Despite the strong move higher, the RSI failed to become overbought. Should commodities begin to stabilize, there could be bullish implications for the Materials sector. However, we want to see a break above the 200-day moving average before changing our cautious view on commodities and the Materials sector.
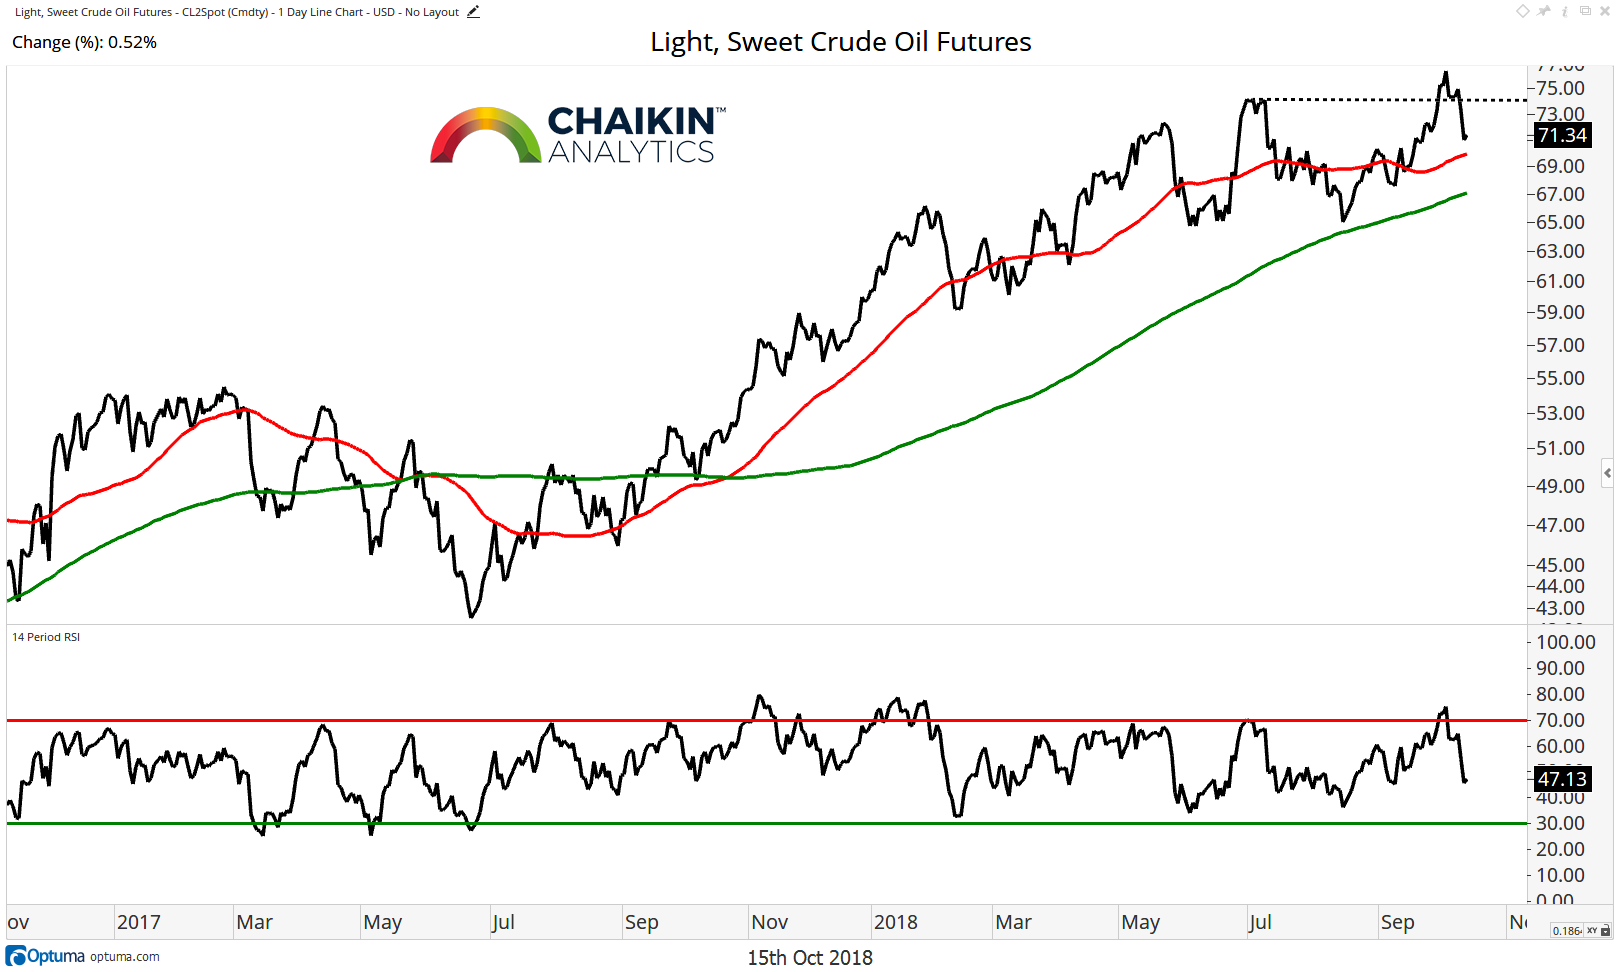
Crude Oil has pulled back after breaking through resistance at $74 (a false breakout?). Lite Sweet Crude Oil remains above the rising 50 and 200-day moving averages. The RSI became overbought as resistance broke and has not registered an oversold reading since June 2017 which speaks to the strength of the current uptrend for crude. Should oil find support at the moving average, it is likely to resume moving higher which could have positive implications for the energy complex.
The Dollar
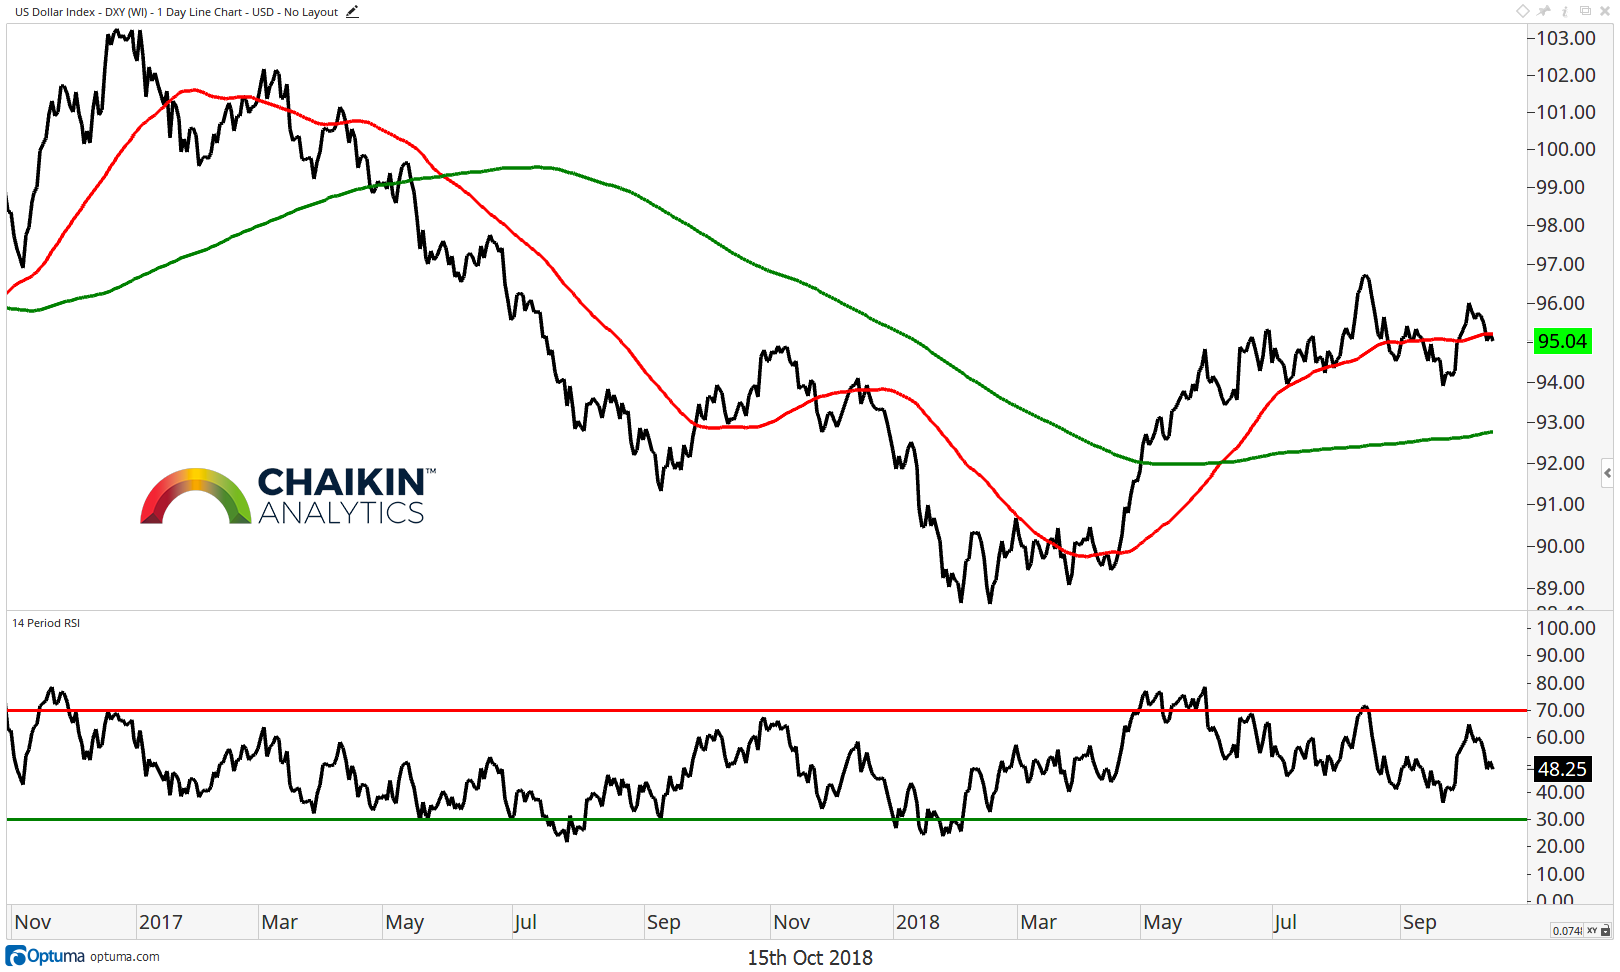
The Dollar Index has pulled back to the 50-day moving average but remains above the 200-day moving average, both of which are flat. The RSI has made a series of lower highs as the index has been consolidating since May. Renewed strength for the dollar should help small caps find a relative bottom while a reversal lower should favor large caps on a relative basis.
Take-Away: Last week we changed our view on the market from bullish to bullish but with a bit more caution and we feel that that remains the prudent course for investors. Should the S&P 500 break the key 2,710 – 2,720 zone, the odds of a 10% correction, to 2,650, are increased. Investors who wish to maintain exposure to equities should consider Very Bullish / Bullish Power Gauge-Rated stocks which have a beta that is lower than the overall market.
Twitter: @DanRusso_CMT
Author may have a position in mentioned securities at the time of publication. Any opinions expressed herein are solely those of the author, and do not in any way represent the views or opinions of any other person or entity.


: Showing Some Signs of Emerging Strength")
