One of the big standouts in the month of October was the decline in crude oil and energy stocks.
All of a sudden, good charts within the space fell apart and crude oil is trading like we’ve just reached a cyclical peak.
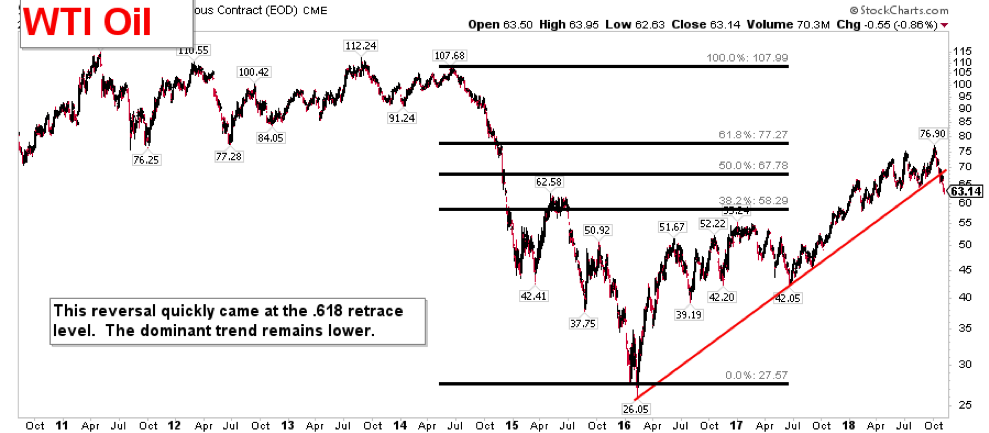
When we look at the longer term WTI oil chart two things stand out.
First, the trend from the 2016 low has been broken.
Second, the trend ended at a very notable area. The 76-77 level was the bottom of the 2011-2014 range as well as the .618 retrace of the major crude oil decline from the middle of the decade. This suggests the dominant trend is still lower.
We can see 62ish (so right around here), the low 50s and low 40s have been major price zones to watch before.
So oil is weak and appears to have topped for this cycle. Let’s shift our focus to the energy stocks.
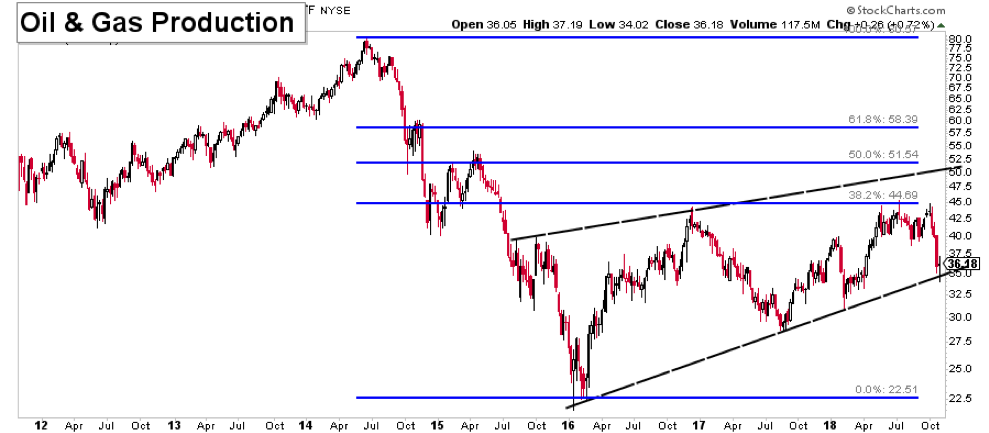
The Oil and Gas Production ETF (NYSEARCA:XOP) has refused to recover the prices from earlier in the decade. Since the 2016 low, price has traded within a corrective structure. While oil has made new high this year, this has failed to make new highs with it.
We can see currently price is at critical trend support from the 2016 low. Again this doesn’t look so great, but these recent low is a good area to be long against.
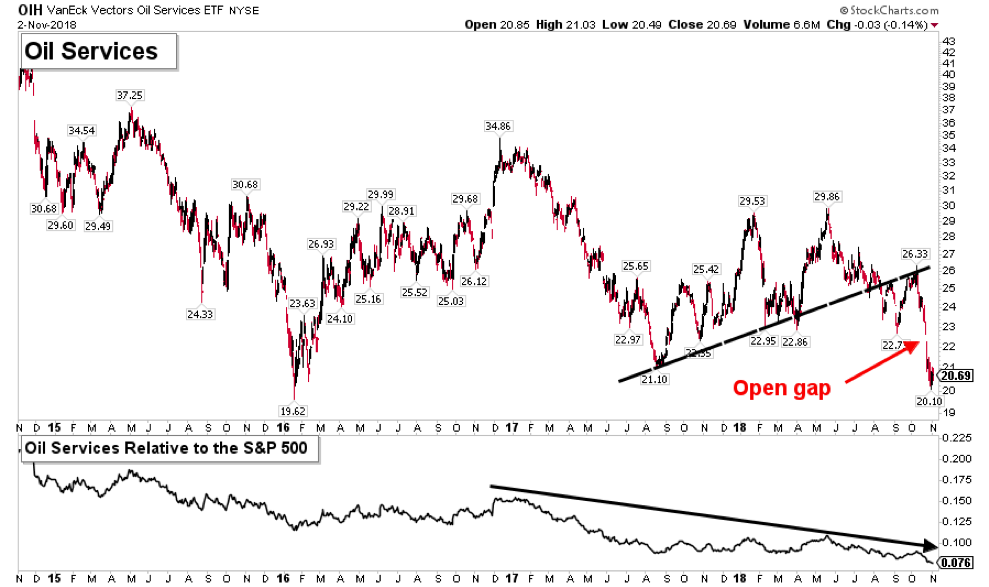
Moving to Oil Services (NYSEARCA:OIH) we see another group that has refused to move higher with energy prices and the overall market for the last two years. This group has major issues, but there is heavy support in this area with the 2016 low nearby. There’s a gap in the 22s that might need filled before a further breakdown. Note how important the upper 22 area has been in the recent past as well.
The energy space is something we’ll have to watch moving forward. This whole area is a red flag for the market on an intermediate term basis.
Thanks for reading. Trade ‘em well!
Twitter: @ATMcharts
Any opinions expressed herein are solely those of the author and do not in any way represent the views or opinions of any other person or entity.

: Showing Some Signs of Emerging Strength")
