Looking across the retail sector, we see a mixed bag.
Today, we look at a big box retailer (Target Corp) and highlight its relative out-performance.
This needs to be put in better context, however. Target is performing in line or slightly better than the sector (depending on the time frame), but it is definitely performing better that super-big box retailers Walmart and Costco.
While the latter two are trading lower of late, Target is consolidating near its highs. This may not mean much in the days ahead, but should this relative out-performance hold, it may mean something down the road.
Note that the following MarketSurge charts are built with Investors Business Daily’s product suite.
I am an Investors Business Daily (IBD) partner and promote the use of their products. The entire platform offers a good mix of tools, education, and technical and fundamental data.
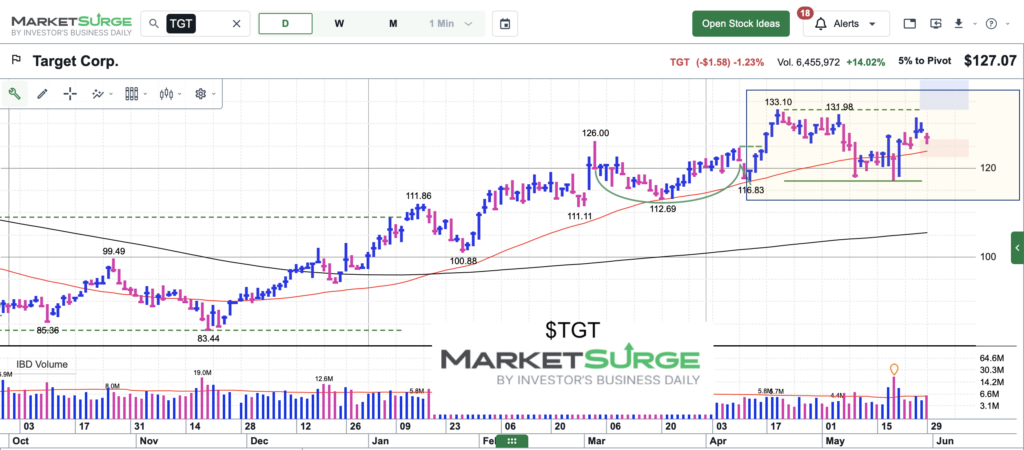
$TGT Target Stock Chart
Target is trading above both its 50 and 200 day moving averages. It is trading in a sideways consolidation, just 4 to 5 percent off its April high. I do not have an opinion just yet on Target… but I will watch it in the days/weeks ahead, especially if it continues to out-perform Walmart and Costco.
It’s also worth noting that on its “weekly” price chart, it has formed a nice “cup” base. Understand that this pattern has room to pull back a bit and still be bullish longer-term.
Twitter: @andrewnyquist
The author may have a position in mentioned securities at the time of publication. Any opinions expressed herein are solely those of the author, and do not in any way represent the views or opinions of any other person or entity.


