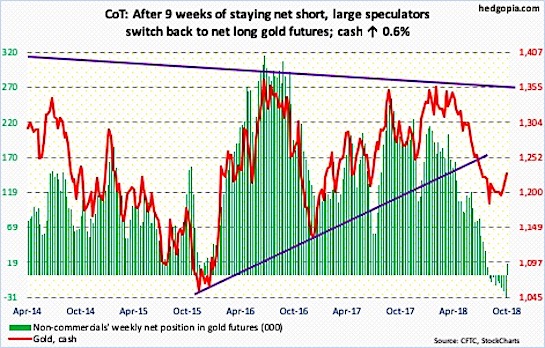
The chart below looks at non-commercial futures trading positions for Gold (NYSEARCA: GLD). For the week Gold closed higher by +0.5%, consolidating recent gains.
Here’s a look at Gold futures speculative positioning. Scroll further down for commentary and analysis.
Note that the chart and data that follow highlight non-commercial commodity futures trading positions as of October 16, 2018. This data was released with the October 19, 2018 COT Report (Commitment of Traders).
Note that this chart also appeared on my blog.
Gold has gained some upside traction over the past two weeks. Bulls will be on alert for follow-through price action this week.
Let’s look at the COT data and technicals to see what’s next…
Gold: Currently net long 17.7k, up 55.8k.
After a big rally on Thursday October 11, Gold has mostly traded sideways. This sideways consolidation may be occurring within a broader sideways consolidation (shorter-term vs longer-term). Should Gold come under pressure near-term, traders should focus on $1213 – that’s the line in the sand.
Looking at flows, gold bugs should be encouraged. Flows into SPDR Gold ETF (GLD) were positive for a 2nd consecutive week, gaining $390 million in the week ending Wednesday.
Twitter: @hedgopia
Author may hold a position in mentioned securities at the time of publication. Any opinions expressed herein are solely those of the author, and do not in any way represent the views or opinions of any other person or entity.

 Testing Important Price Support")
: Cup (and Maybe Handle) Watch")

