The chart below looks at non-commercial futures trading positions for Gold (NYSEARCA: GLD). For the week Gold closed higher by +1.4%, breaking out above key resistance.
Here’s a look at Gold futures speculative positioning. Scroll further down for commentary and analysis.
Note that the chart and data that follow highlight non-commercial commodity futures trading positions as of October 9, 2018. This data was released with the October 12, 2018 COT Report (Commitment of Traders).
Note that this chart also appeared on my blog.
Gold is attempting to breakout to the upside. Traders should be on alert for follow-through price action this week.
Let’s look at the COT data and technical to see what’s next…
Gold Futures Positioning: Currently net short 38.2k, up 16.4k.
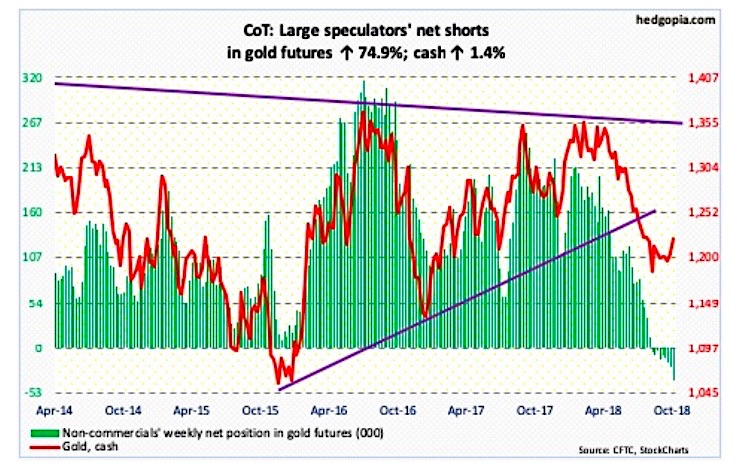
Precious metals bulls finally received their wish: a breakout. This came during a high volume session on Thursday that saw Gold rally 2.9 percent and its 50 day moving average. The rally came off the lower Bollinger band and after defending lower support at $1,180.
On the weekly chart the MACD made a bullish crossover, which adds support to the breakout. But the 4 month decline in prices has left several levels of resistance that Gold will have to overcome if it wishes to mount an enduring rally.
During the week ending on Wednesday, the SPDR Gold ETF (GLD) gained $337 million in flows. Time to pay attention.
Twitter: @hedgopia
Author may hold a position in mentioned securities at the time of publication. Any opinions expressed herein are solely those of the author, and do not in any way represent the views or opinions of any other person or entity.

 Testing Important Price Support")
: Cup (and Maybe Handle) Watch")

