Tag: RSI
S&P 500 Index Displaying Bullish RSI Pattern
Welles Wilder first unveiled the Relative Strength Index in the 1970s as a way to measure price momentum for commodities. Connie Brown and Andrew Cardwell...
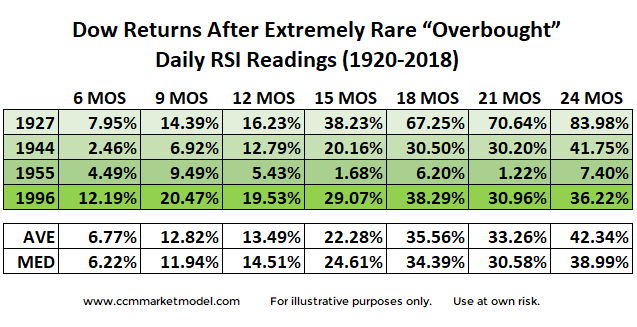
Market Study: What Happens When RSI Gets This Overbought?
How Should Investors Interpret Severely Overbought RSI Readings?
If someone told you the Dow’s daily RSI recently printed the “most overbought” reading since 1955, that...
Combining Trading Rules To Smooth Performance
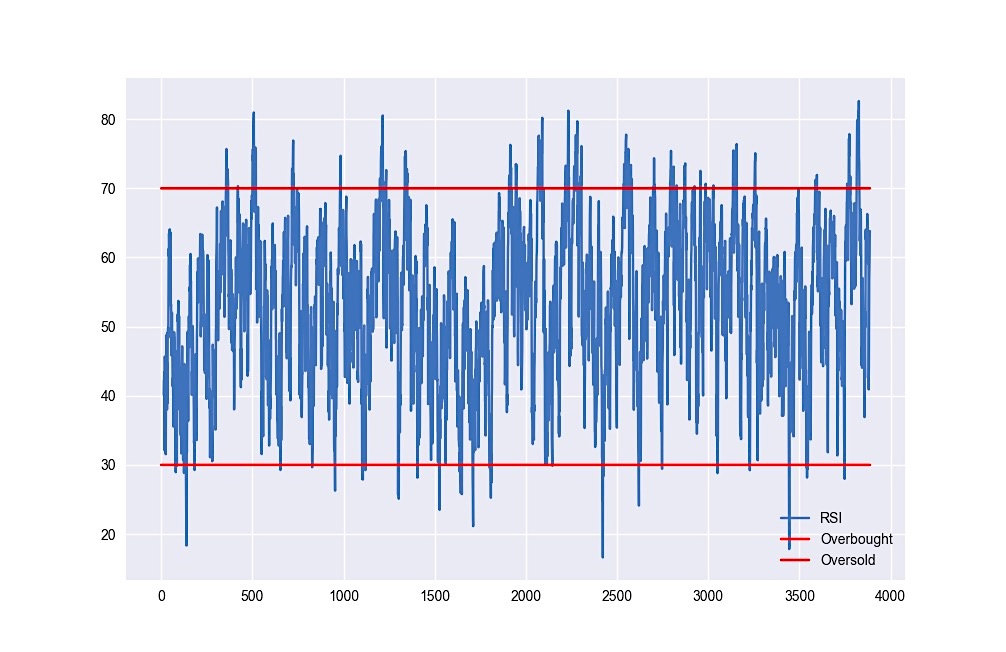
The market is “overbought” or “oversold” are common phrases you will hear across the finance space. However, it is actually extremely rare for these...
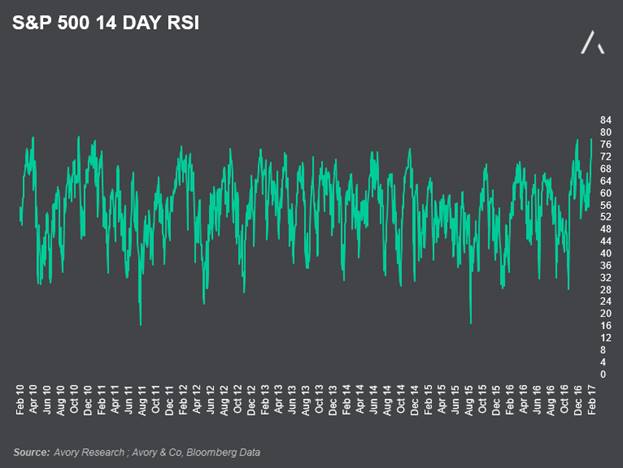
Stock Market Mo-mo: Relative Strength Index Nears 7 Year Highs
The markets continue to make all-time highs leaving many wondering how long this can last. We went ahead and looked at various momentum indicators,...
Searching For An Apple Stock Bottom: Watch This Indicator
The Bears have sunk their teeth into shares of Apple (AAPL) with the stock recently trading down as much as -17.57% from its April...
Using VXX Spikes To Generate Equity Buy Signals
The VXX Short-Term Volatility Futures ETF has been much maligned since its launch and one glance at the chart below shows why - it’s...
S&P 500 Fibonacci Pullback Sequence: About To Play Out Again?
The structure of the S&P 500's (SPX) uptrend continues to follow a script that has become even more consistent in 2014 than it was...


