The structure of the S&P 500‘s (SPX) uptrend continues to follow a script that has become even more consistent in 2014 than it was in 2013. The following sequence has pegged each trend regime – up, neutral, and down – this year as the index completed major oscillations in January-March, March-June, July-September; and is now about to finish another.
- Price moves sideways in a tight (1-2%) congestion zone for 2-5 weeks, culminating with a nominal higher high that peeks just above the preceding range.
- This higher high occurs at or in close proximity to rising channel resistance (orange)
- A pullback immediately begins, consisting of 3 waves down (noted in white, below) where Leg B is a modest dead cat bounce and a final Leg C is installed that is smaller than and ends with a lower low v. Leg A (check out lower timeframes for positive momentum divergences between Legs A and C on RSI, %B, MACD etc.).
- A “V-bottom” rally begins (at channel support, with the noteworthy exception of October)
- The rally extends to a higher high, usually 127.2% of 161.8% (fibonacci extensions) of the previous high, where the congestion zone noted in 1, above, begins.
Note that in every case, the V-bottom in Step 4 pushed RSI up to an overbought state (>70), where the rally would catch fire for a brief period before sputtering back into Step 1.
Here’s the progression on the SPDR S&P 500 ETF (SPY):
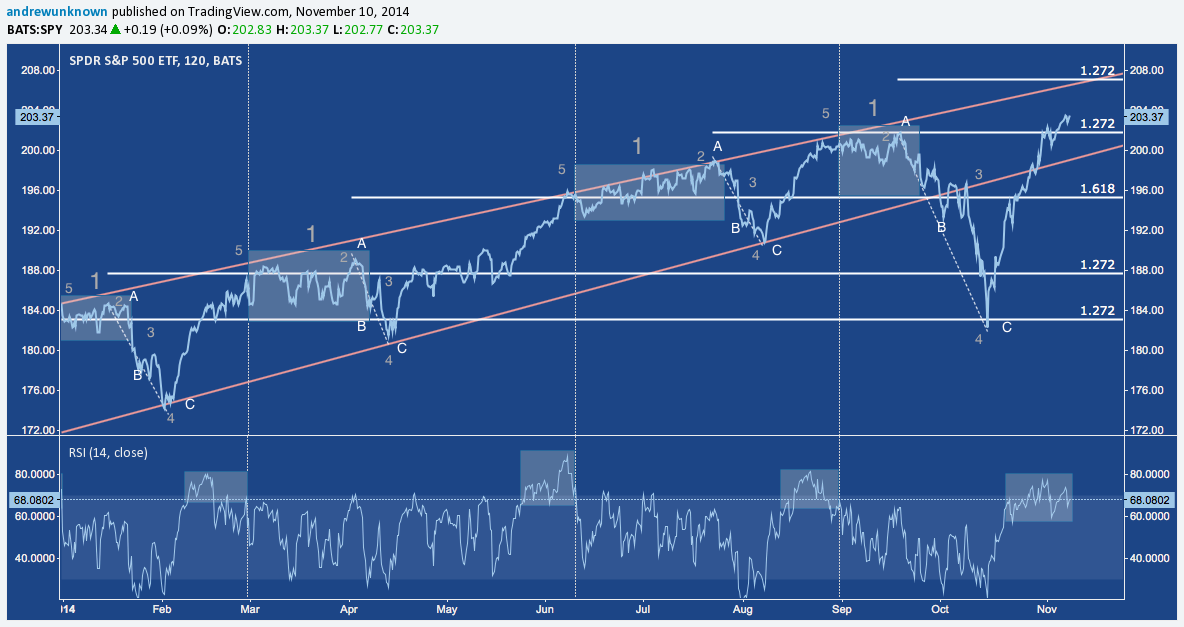
Three of the four major trend oscillations in 2014 ended at the 127.2% extension, while the fourth (Jul-Sep) ended at the 161.8% extension.
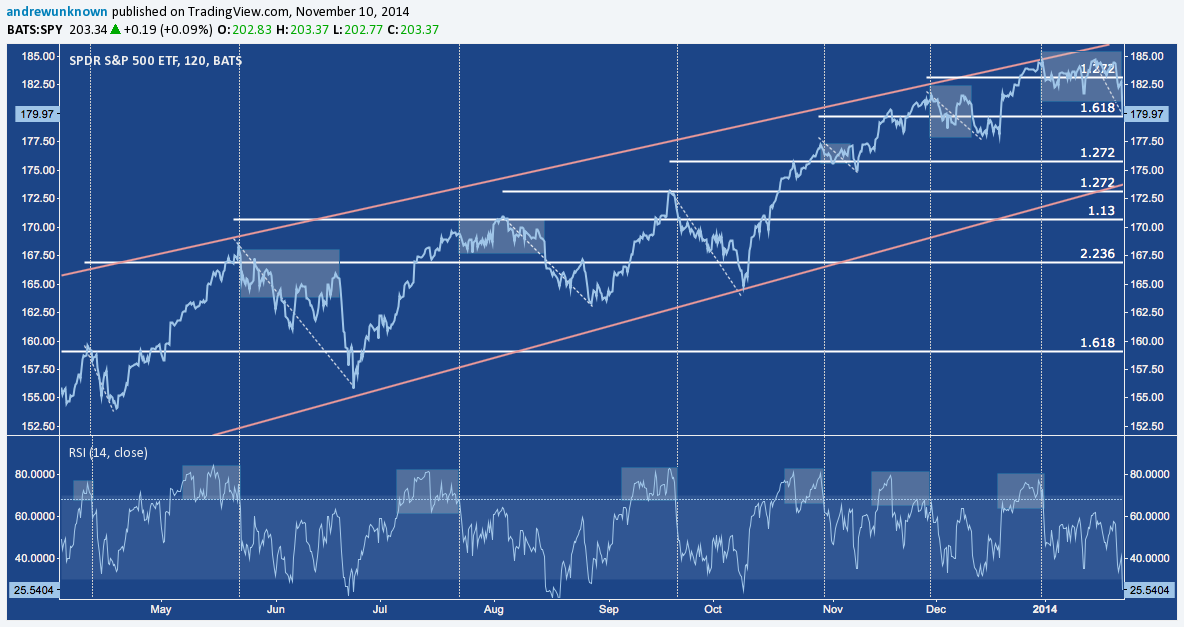
As mentioned, this structure extends back into 2013. The same sequence is present across six full oscillations from April-December -i.e., uptrend, neutral at fibonacci extension, pullback – though one (May-Jul) ended at the 113.1% extension, while another (Apr-May) ended at the 223.6% extension.
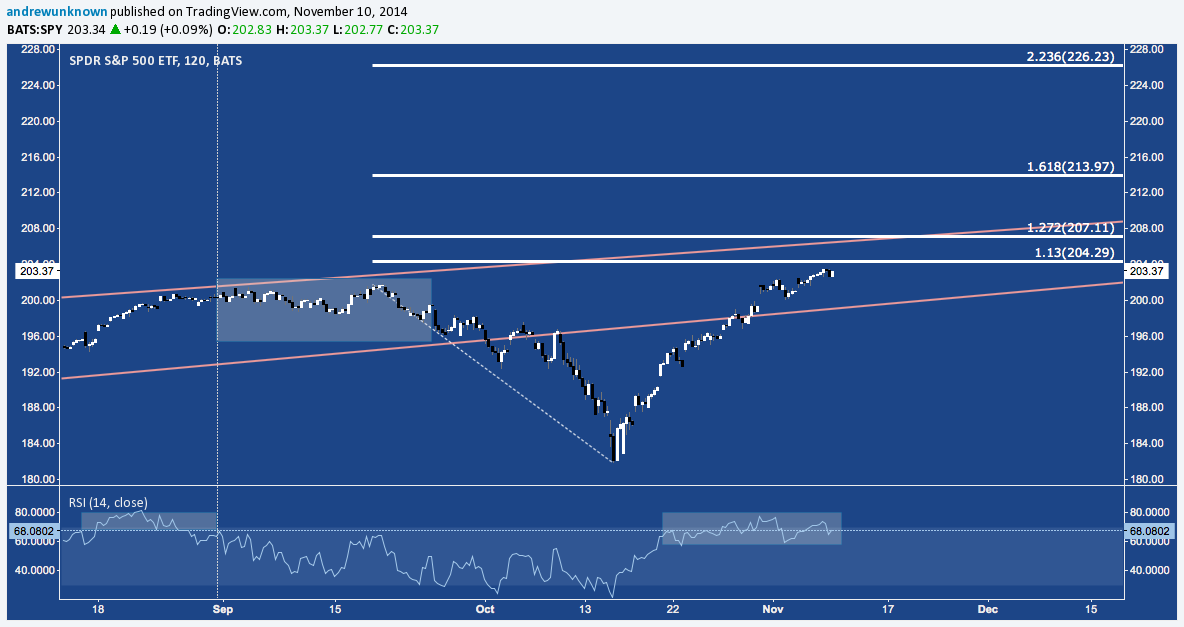
Here’s a view of the current sequence. Notice that half of it has occurred since RSI tagged 70 on October 22. The 113.1%, 127.2%, 161.8% and 223.6% extensions that have come into play across the 10 previous occurrences highlighted above are plotted: note their distribution is concentrated around 127.2% (with N=5) and 161.8% (N=3), together comprising 8 of 10. Moreover, SPY has regained the 2013-2014 Rising Channel, where overhead trend line resistance coincides in price and time with the 127.2% extension, giving a higher probability target for the current leg up near 207.
The entirely uncharacteristic rising channel break, already lengthy RSI congestion (relative to these 10 observations) around 70 and signs momentum is flagging over the last week beg the question, though: can SPY push that far before rolling into its next pullback?
Twitter: @andrewunknown
Author holds no exposure to instruments mentioned at the time of publication. Commentary provided is for educational purposes only and in no way constitutes trading or investment advice.

: Worrisome to Broader Market?")

