How Should Investors Interpret Severely Overbought RSI Readings?
If someone told you the Dow’s daily RSI recently printed the “most overbought” reading since 1955, that might understandably raise bearish concerns. While it is true the Dow’s daily RSI recently reached 88.1, which is the highest stock market overbought reading since hitting 89.15 in 1955, that does not tell us much about what it may mean or how we are supposed to use it.
Has Only Happened In Four Other Periods
To better understand what we can learn from extremely rare overbought readings, it is prudent to look back in time.
Between 1920 and 2018, daily RSI readings above 86 have only occurred a handful of times (see table below). We used the Dow in this study since data for the S&P 500 only goes back to 1925.
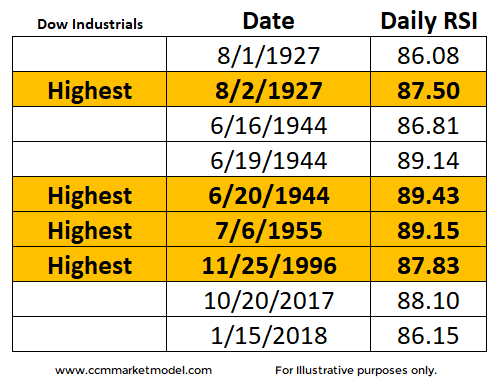
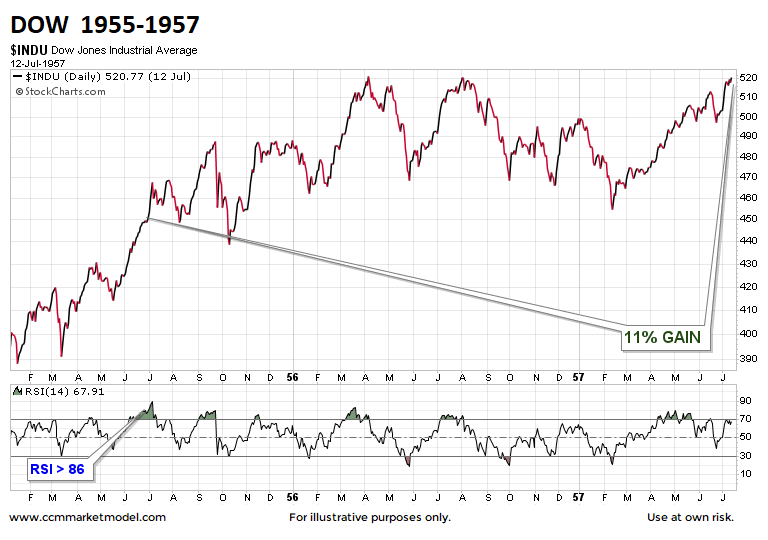
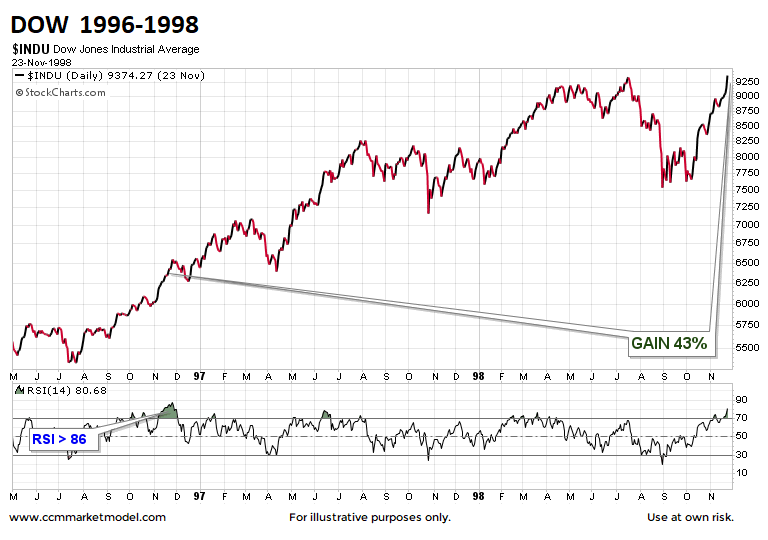
Since we are concerned about “severely overbought”, we will focus on the four dates with the highest readings from each period highlighted above.
What Happened Next?
As shown in the table below, after experiencing extremely rare stock market overbought readings, stocks performed very well over the next two years.
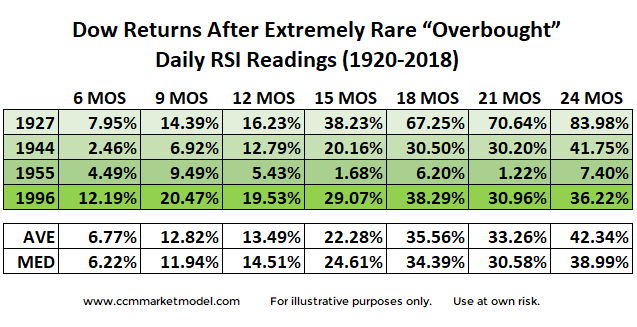
Like anything in the markets, the impact of overbought readings is highly dependent on your timeframe. Given (a) our timeframe is long in periods marked by strong trends, and (b) stocks performed very well in every historical case shown above over the next two years, recent “overstretched” RSI readings have little to no impact on our day-to-day approach.
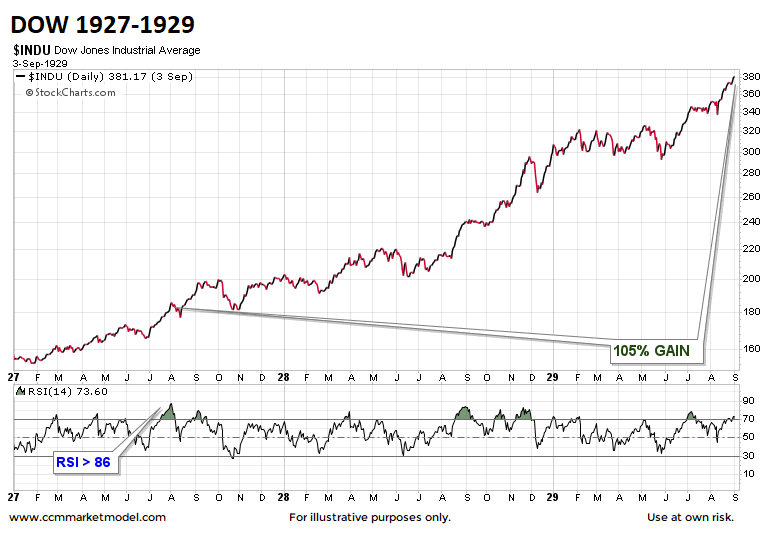
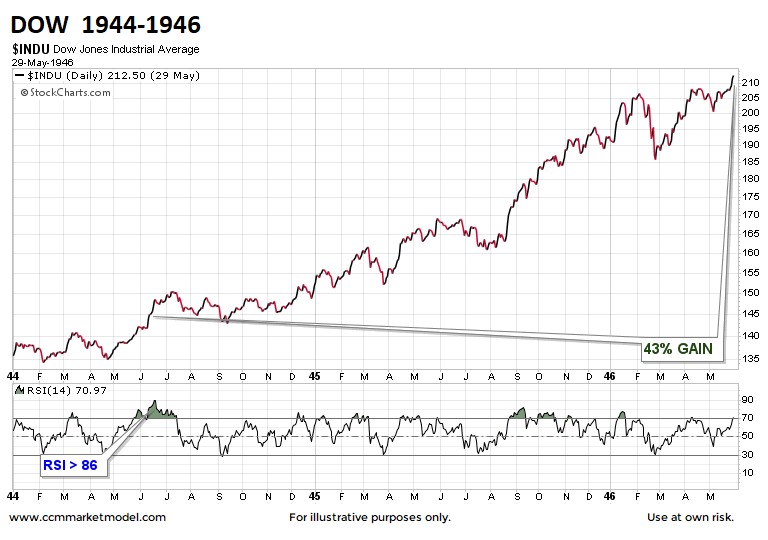
Charts – All Four Historical Periods
One important takeaway from all four periods below; volatility is a normal part of all bullish trends. Therefore, even if present-day trends continue, none of us should be surprised when the inevitable pullbacks and corrections occur.
1995 May Be Best Match
Regular readers and viewers of CCM’s weekly videos know we have covered numerous pieces of hard evidence that tell us the setups in 2016-2017 were similar to the setups in 1994-1995. A December 2016 See It Market post shows comparisons between the two periods. A December 2016 video asked is 2017 more like the 1987 crash or 1995 bash?
Note that the links below address many common follow-up questions that come up after reviewing an overbought analysis.
What About Other Timeframes?
A similar “stocks are way overbought” analysis was performed in March 2017 using monthly RSI. The basic conclusion was the same; overbought can be bullish in environments marked by strong trends. Since the bullish monthly “overbought” RSI analysis was published, the S&P 500, NASDAQ, and Dow all have tacked on double digit gains. Overbought in March 2017 was not bearish.
Concepts Apply To All Timeframes
Market fractals tell us the same concept of “overbought is not necessarily bearish in the context of strong bullish trends” applies to all timeframes (60 min, daily, weekly, monthly, and annual).
We covered numerous annual “overbought” indicators that turned out to be bullish signals on November 3, 2017 and November 10, 2017.
If you want to review the “overbought” RSI concept using weekly charts, see this February 2017 analysis.
What About Valuations?
Standard PEs were covered on See It Market in January 2017. The Shiller PE or CAPE ratio was covered on January 16, 2018.
Twitter: @CiovaccoCapital
The author or his clients may hold positions in mentioned securities at the time of publication. Any opinions expressed herein are solely those of the author, and do not in any way represent the views or opinions of any other person or entity.


