Consolidation And Confusion Often Precede Big Moves In Stocks
The S&P 500 Index (INDEXSP:.INX) recently broke out of a multiple-year consolidation box, similar to the bull market breakouts in 1995 and 1985 (see three charts below). The possible relevance for 2016-2017 can be seen by reviewing the historical charts in this post (1982-2016).
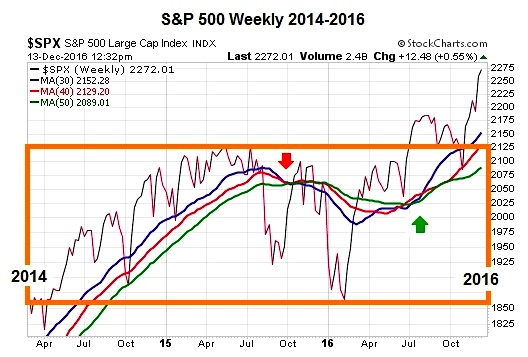
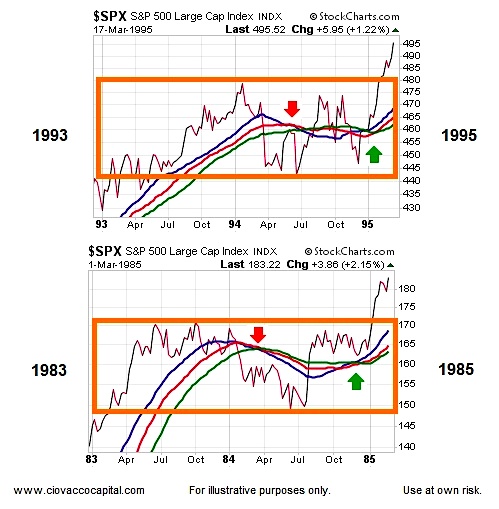
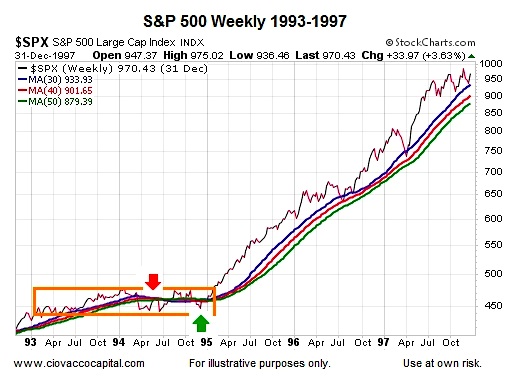
Since human psychology, greed, and fear have remained consistent throughout human history, markets often trace out similar patterns near key turning points. The three weekly charts above reflect similar human behavior. In all three periods:
- Stocks consolidated for roughly two years, which is indicative of a relatively even match between bulls and bears.
- When fear dominated in the orange boxes, long-term trends flipped negative for a relatively brief period (red arrows).
- Bullish conviction eventually was strong enough to flip the long-term trends back in the bull’s favor (green arrows).
- Eventually, the period of consolidation and indecisiveness ended as stocks broke above the orange boxes.
Only Ten Similar Trend Changes Have Occurred Since 1982
While 2016 is radically different in many ways to every year between 1982 and 2015, markets move based on the net interpretation of all the fundamental data of the day. When the net interpretation flips bearish, negative trends tend to form (red arrows). When the net interpretation flips to the bullish end of the spectrum, long-term bullish trends tend to dominate (green arrows). Therefore, while the mix of fundamental data (valuations, earnings, Fed policy,…) varies from period to period, the consistent theme is markets move based on the net interpretation of all the fundamental data. Once the net interpretation flipped bullish in the chart below, stocks rallied for some time.
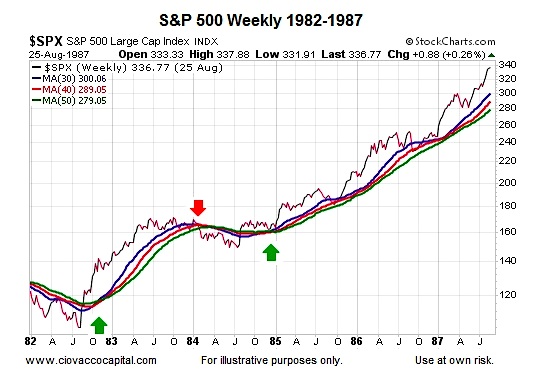
Keep in mind, the first set of charts in this post showed the similarities between investor psychology in 1985 and 2016; the chart above shows what happened next in 1985. Will 2016 be added to this list of bull market breakouts.
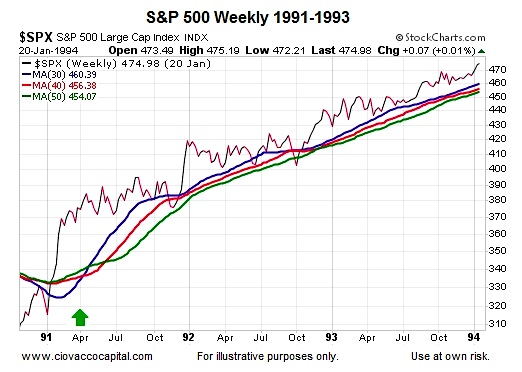
1991 Was Significantly Different Than 1982
While the mix of fundamental data was different, good things still happened after the net aggregate interpretation of the data flipped bullish in 1991 (green arrow below).
Detailed Look At All Ten Bullish Turns 1982-2015
The historical charts above were first covered in our August 19 video. Since the bullish signals were published, the S&P 500 has gained 4.2%.
1994: The Longer A Market Goes Sideways…
The chart below is a textbook example of the expression “the longer a market goes sideways, the bigger the move we can expect after either a bull market breakout or bearish breakdown”. Keep in mind, the first set of charts in this post showed the similarities between investor psychology in 1995 and 2016; the chart below shows what happened next in 1995.
continue reading on the next page…

: Showing Some Signs of Emerging Strength")
