Bearish Breakdowns Are Part Of The Equation
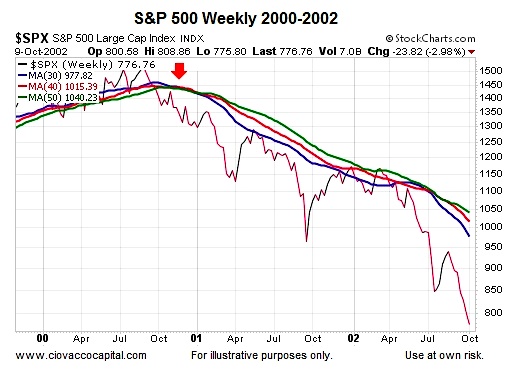
While there is nothing magical about using the 30, 40, and 50-week moving averages, they allow us to illustrate basic concepts about long-term trend shifts. Shifts can be bullish or shifts can be bearish, as shown in the 2000-2002 example below.
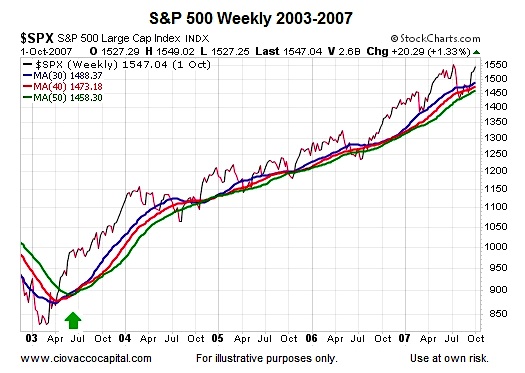
2003 Was Radically Different Than 1982
Are the fundamentals in 2016 different from the fundamentals in 1982 and 1994? Yes, just as the fundamentals were different in 2003 relative to 1982. The mix of fundamentals varies from year to year in the markets; a concept that has remained constant through history. Each year follows a unique script, with similarities sprinkled in among the variations.
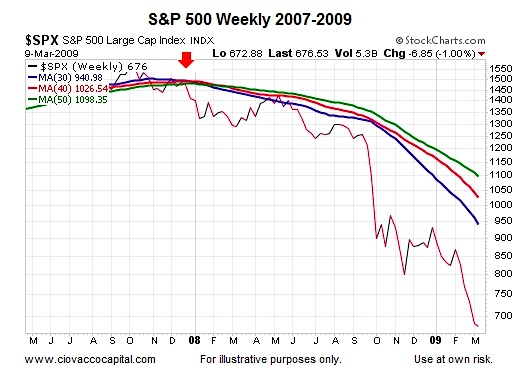
2007: Aggregate Opinion Turns Bearish
The net aggregate interpretation of all the fundamentals turned bearish in late 2007; stocks did not regain their footing until 2009.
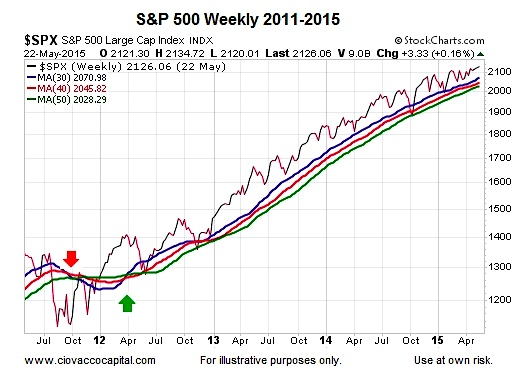
Harder Markets Often Followed By Easier Markets
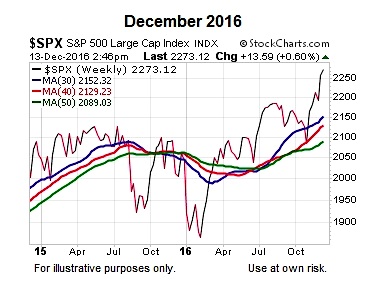
Given the sideways price action within a wide range between late 2013 and late 2016, it is fair to say 2013-2016 falls into the “harder market” category when viewed from a long-term trend perspective. The easier period below (2013-2014) was preceded by a harder period (2010-2012).
Purpose Is To Understand Rather Than Forecast
This analysis shows the look of the present day chart (below) and compares it to historical charts; nothing more…nothing less. The present day chart is a fact; the historical charts are facts; no opinions or political biases are involved.
Will the harder period (2013-2016) be followed by an easier period (2017-2019) marked by stronger and more decisive trends? Only time will tell. It should also be noted, these are long-term signals that assist us with probabilities looking out weeks, months, and years. These signals tell us very little about shorter-term outcomes (hours, minutes, days).
In our approach, if the trends remain in place, as they are today, we will maintain a growth-oriented stance. If the trends flip via another whipsaw, which is always possible, we will make the necessary defensive adjustments. Right now, the charts from a longer-term perspective look favorable. How they will look in three weeks, three months, or three years falls into the TBD category.
Thanks for reading.
Read more from Chris over on CCM.
Twitter: @CiovaccoCapital
The author or his clients may hold positions in mentioned securities at the time of publication. Any opinions expressed herein are solely those of the author, and do not in any way represent the views or opinions of any other person or entity.

: Showing Some Signs of Emerging Strength")
