Welles Wilder first unveiled the Relative Strength Index in the 1970s as a way to measure price momentum for commodities. Connie Brown and Andrew Cardwell enhanced the use of this technical indicator by focusing on momentum divergences as well as the bullish and bearish phases of RSI.
While traders tend to focus on overbought and oversold conditions as a measure of short-term mean reversion, I have found that combining these short-term indications with the longer-term patterns of divergence and phase can paint a much more complete picture of price dynamics.
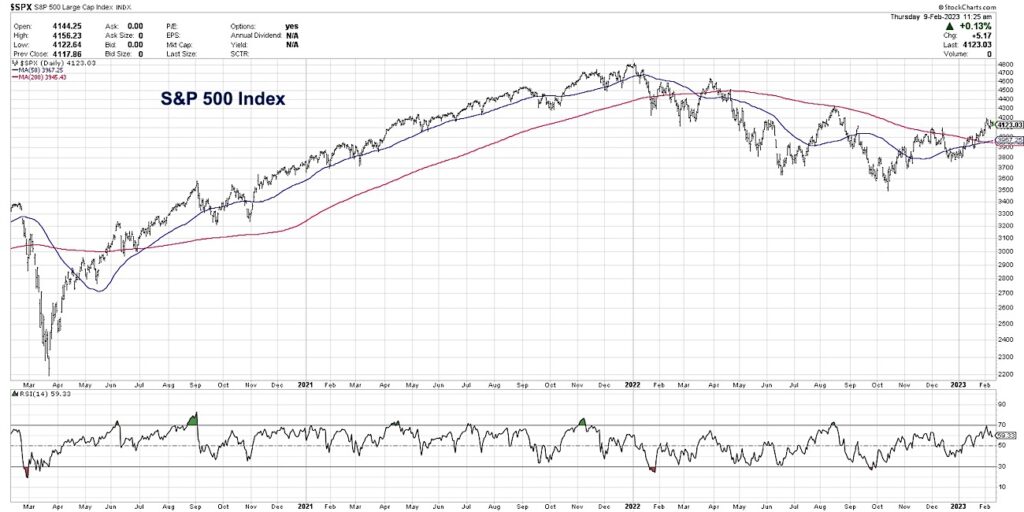
In today’s video, we’ll break down the chart of the S&P 500 index using RSI with a focus on short-term and long-term signals and patterns. You’ll see why the current configuration suggests a short-term pullback is likely, yet also confirms that a larger bull market phase has begun.
- What does it mean that the S&P 500 became overbought on its recent break above the 4100 level?
- Does the lack of any bearish divergence indicate further strength ahead for stocks?
- How does the range of the RSI readings in recent months help us determine the longer-term phase for this key market benchmark?
VIDEO: S&P 500 Index RSI Patterns
Twitter: @DKellerCMT
The author may have positions in mentioned securities at the time of publication. Any opinions expressed herein are solely those of the author, and do not in any way represent the views or opinions of any other person or entity.


