The markets continue to make all-time highs leaving many wondering how long this can last. We went ahead and looked at various momentum indicators, including the 14 day relative strength index (RSI).
Below is a chart of RSI readings on the S&P 500 (INDEXSP:.INX) since 2010. As you can see we are approaching 7 year highs in RSI, with the reading sitting at 78.01.
S&P 500 Chart – 14 Day RSI Chart
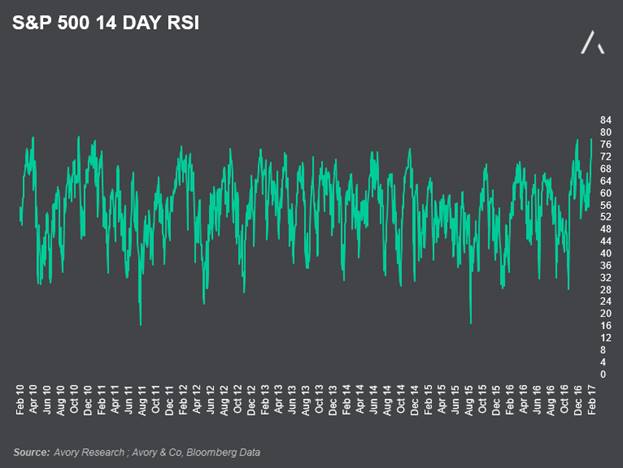
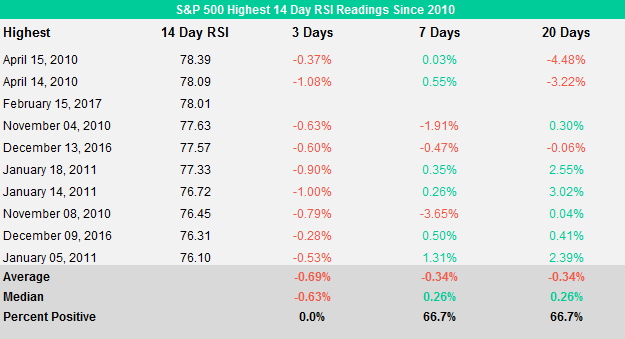
As illustrated below, the current reading is the 3rd highest since 2010, and the highest since April of that year. We went ahead and analyzed the historicial forward returns to see how markets have reacted to extermely high levels of momentum.
We focused on the top 10 readings which highlighted to us that returns over the next 3 days were positive on no occasions, and averaged -.69%. The worst return was a mere 1%, which is nothing to panic about. Over a 7 day trading period, and a 20 day trading period, the returns are fairly neutral. Over a 7 day period the returns averaged -.34%, finishing positive 67% of the time, and the worst return being -3.95%. Over a 20 day trading period returns averaged -.34%, finishing positive also 67% of the time, and the worst return was a drop of -4.48%. All-in-all momomentum is elevated, therefore it is only normal for markets to consolidate, and the historical numbers suggest this may be the case.
S&P 500 Chart – Highest 14 Day RSI Readings Since 2010
Thanks for reading.
Also from Sean: Stock Market Seasonality Trends: February & Beyond
Twitter: @_SeanDavid
Any opinions expressed herein are solely those of the author, and do not in any way represent the views or opinions of any other person or entity.


